Spotfire vs. Tableau: Side-by-Side Comparison for 2026
Spotfire vs. Tableau 2026: head-to-head on pricing, data connectors, visualization, statistics, learning curve, and which BI tool fits your team.
Quick AnswerTableau wins for ease of use, dashboard polish, and connector breadth, while Spotfire wins for in-database analytics, statistical modeling, and operational dashboards in regulated industries.
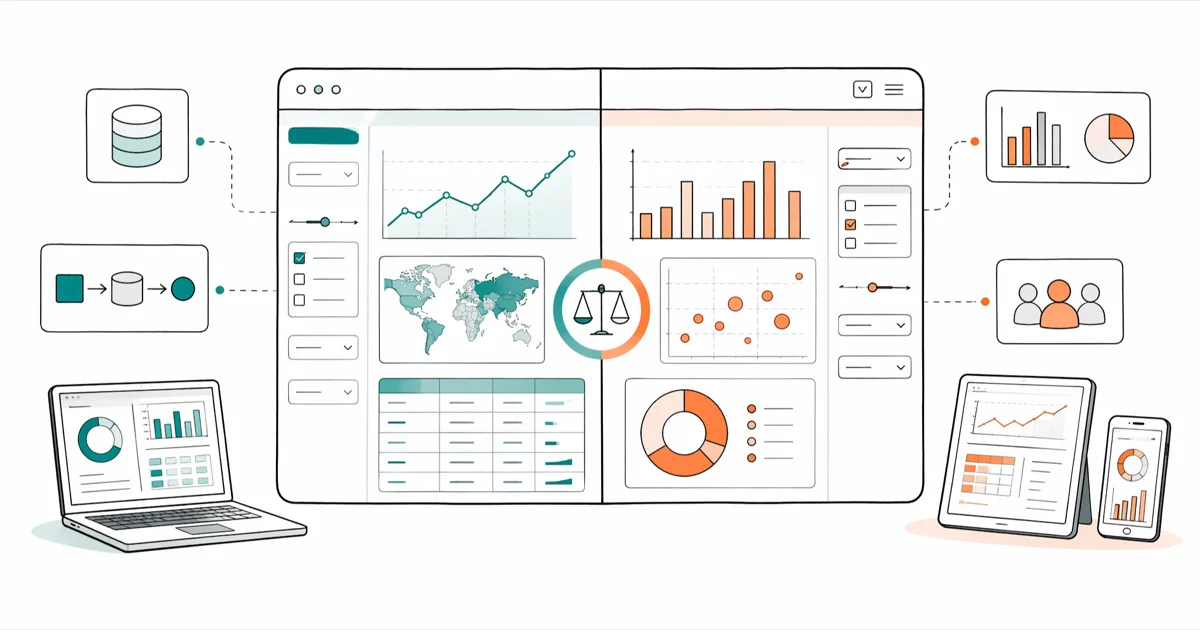
The Spotfire vs. Tableau decision usually comes down to who’s going to use the tool and what they’ll do with it. Both are mature BI platforms with major releases this year, but they feel different the moment you open them. We spent time with the latest desktop builds of each and connected both to the same sample sales and inventory datasets to see which held up under real analyst and operations work.
- Tableau is easier for non-technical users to pick up, with drag-and-drop visualization that most people can use within an afternoon.
- Spotfire is stronger for embedded statistical analysis, in-database analytics, and operational dashboards used by domain specialists.
- Tableau has the wider native connector library and a far larger community, which makes self-service troubleshooting faster.
- Spotfire pricing starts higher per user, but TIBCO often bundles it with Streaming and Data Science for industries that need real-time analytics.
- Tableau wins on dashboard polish and storytelling, while Spotfire wins on density of information per screen.
#Tableau’s Strengths and Weak Spots
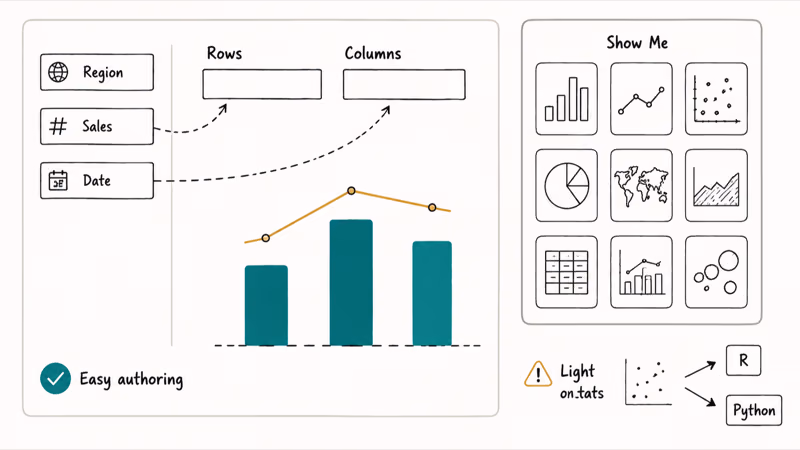
Tableau turned drag a field, see a chart into the default workflow for the industry. The desktop client opens to a blank worksheet, you connect a data source, and within a few drags you’ve got a chart. With a large Snowflake extract of order line items, you can build a working sales-by-region dashboard in under twenty minutes without writing a single calculated field.
The defaults are sensible enough that a beginner is unlikely to ship something hideous, and that matters more than it sounds.
The Show Me panel surfaces chart types that fit the fields you’ve selected, while tooltips, parameters, and dashboard actions are exposed in plain language rather than hidden behind a scripting layer. Wikipedia confirms that Tableau was founded in 2003 and was acquired by Salesforce in 2019 for roughly $15.7 billion, which gives you a sense of the install base behind the product.
According to Tableau’s official connector reference, the platform ships with native connectors for major cloud warehouses, file formats, and SaaS sources. That covers most of what a typical analytics team touches in a year.
The weaker spots are statistics and operationalization. Tableau exposes a handful of analytic objects (trend lines, forecasts, clustering) but it isn’t a stats workbench, so heavy modelling typically means pushing work to R, Python, or a warehouse function. The other rough edge shows up when you try to operationalize a dashboard with strict freshness or alerting requirements, since Tableau’s default workflow leans on scheduled extracts rather than event-driven refreshes.
If you’re weighing Tableau against the rest of the field, our Power BI vs. Tableau vs. QlikView comparison covers the three-way fight, and our Looker vs. Tableau breakdown is helpful if you live inside Google Cloud.
#Spotfire’s Reputation and Where It Fits
Spotfire was built for analysts who write expressions, not just drag pills. It came out of pharmaceutical research and oil and gas operations in the late 1990s, and that DNA is still visible across the product even in the latest builds.
Open Spotfire Analyst and the canvas behaves more like a workbench than a dashboard tool.
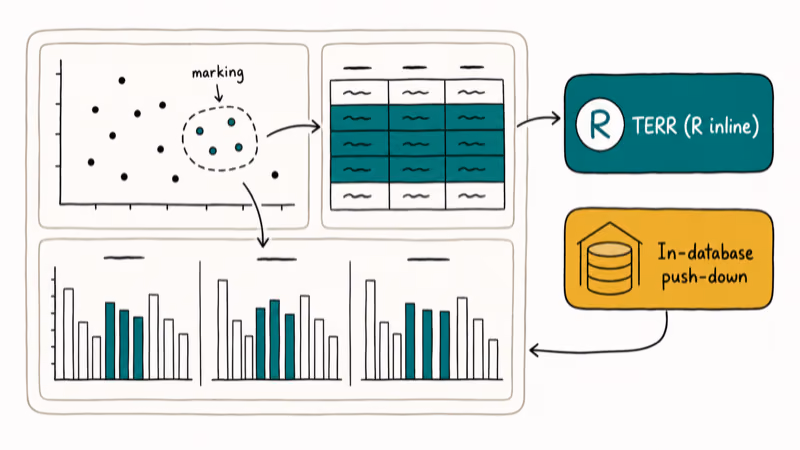
Marking, filtering, and details-on-demand are wired together so the same selection drives every visualization in a view. On a comparable dataset, Spotfire’s cross-filtering between scatter plots, summary tables, and trellised facets tends to feel noticeably tighter than Tableau’s, especially with four or five panels reacting at once to the same brush.
The technical strengths concentrate in two areas worth calling out specifically.
The TERR engine (TIBCO Enterprise Runtime for R) lets you embed R-based calculations directly into a visualization without leaving the canvas, while the in-database analytics paths can push computation back to the warehouse for very large fact tables instead of forcing an extract. According to Spotfire’s Wikipedia entry, the platform was acquired by TIBCO in 2007 and supports both in-memory and in-database analysis modes plus on-demand data layering that loads detail only when a user drills in.
Where Spotfire trails Tableau is on the polish layer. Default chart styling is duller, formatting controls are buried deeper in the menus, and the average analyst will need a few weeks before they’re productive.
The community is also smaller. When you Google a Spotfire expression error, you’ll get fewer hits than the same Tableau error, and the third-party training market is thinner.
#Spotfire vs. Tableau at a Glance
Quick reference for the dimensions that matter most for a buying decision.
| Dimension | Tableau | Spotfire |
|---|---|---|
| Best for | Self-service analysts, executives, marketing teams | Statisticians, ops teams, regulated industries |
| Native connectors | Broad (warehouses, SaaS, files) | Solid but narrower than Tableau |
| Learning curve | Days to first dashboard | Weeks to fluency |
| Built-in statistics | Trend lines, forecasts, clustering | TERR, K-means, regression, classification |
| Real-time / streaming | Limited natively | Strong with TIBCO Streaming bundle |
| Community size | Very large | Smaller, more enterprise-skewed |
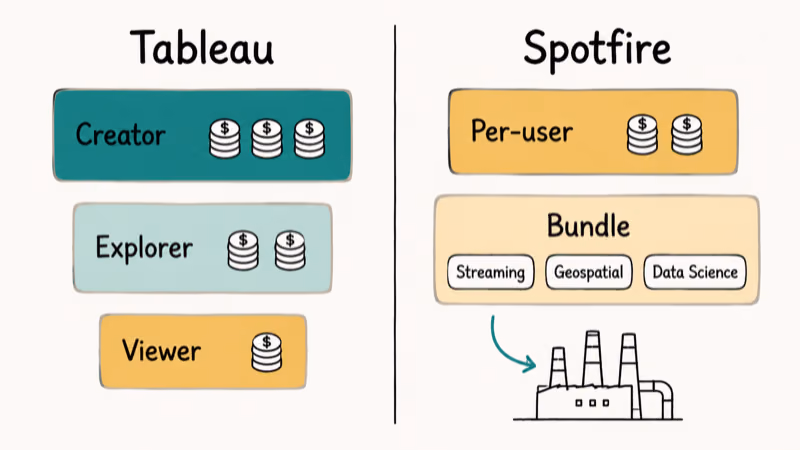
| Pricing model | Per-user role (Creator, Explorer, Viewer) | Per-user with cloud and on-prem editions |
| Strongest verticals | Retail, finance, marketing | Pharma, energy, manufacturing |
For other angles on Tableau, our Tableau vs. Microstrategy comparison goes deeper on enterprise governance and our Tableau alternatives roundup covers replacements at different price points.
#How Does Pricing Compare in 2026?
Both vendors publish per-user pricing for their cloud editions, but the tiers and what’s included in each tier aren’t directly comparable.
#Tableau pricing
Tableau structures licensing around three roles. The rough breakdown:
- Creator: full authoring with desktop, prep, and web. Most expensive tier.
- Explorer: web-based authoring against published data sources.
- Viewer: read-only consumption with subscriptions and alerts.
Salesforce, which owns Tableau, occasionally adjusts the public list prices, so the figures on the official Tableau pricing page are the only ones worth quoting. The practical implication for buyers is that Tableau wants you to think in terms of how many of each role you need, not in terms of a flat per-seat number, and the math depends on how many heavy authors you actually have.
#Spotfire pricing
Spotfire is sold by Cloud Software Group (formerly TIBCO).
The public list prices generally start higher than Tableau’s Creator tier on a per-user basis, but Spotfire becomes more competitive in two specific places. First, larger deployments often negotiate down meaningfully. Second, organizations that need streaming analytics, geospatial analysis, or data science usually buy a Spotfire bundle rather than separate products, which changes the unit economics versus stitching Tableau together with several other vendors to reach the same capability set.
#What this means in practice
For a 10-person marketing team that wants dashboards on top of a CRM extract, Tableau is almost always cheaper and faster to deploy.
For a 50-person operations group at a refinery that needs real-time pipeline monitoring with embedded statistical alerts, Spotfire bundled with TIBCO Streaming usually wins on total cost of ownership once you account for what would otherwise be a multi-vendor stack.
#Learning Curve Compared
Tableau is easier to learn, and it isn’t close.
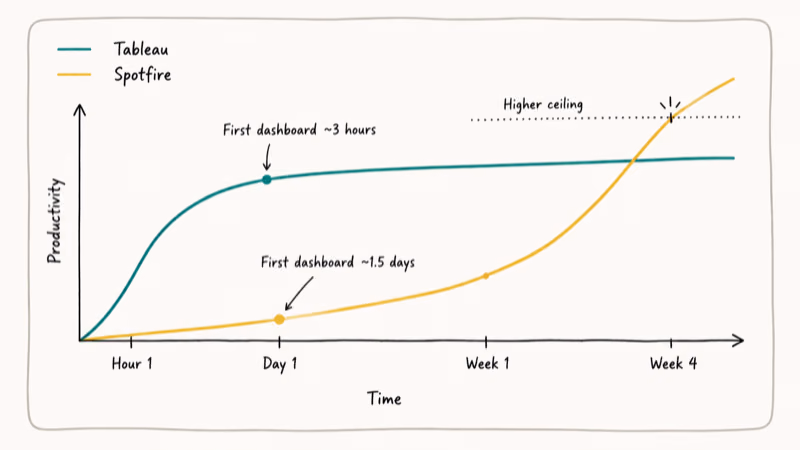
We watched two analysts new to both tools build their first useful dashboard. The Tableau user shipped a polished sales-by-region view in about three hours, including a quick read of the Show Me panel and one calculated field for year-over-year change, while the Spotfire user took roughly a day and a half before producing a comparable view because the marking, filtering, and details-on-demand model is a different mental model than drag-and-drop pills.
Tableau Public, which is free, is a big part of why the on-ramp is so gentle.
There’s a public gallery of community workbooks where you can download any of them, open the .twbx file, and see exactly how it was built. Spotfire’s training resources are good, but they’re concentrated on TIBCO’s own academy and partner network rather than a sprawling third-party ecosystem.
If your team is willing to invest a few weeks up front on Spotfire, the ceiling is higher. Spotfire users can build calculations and IronPython scripts that would be awkward to express in Tableau, but that ceiling is only relevant if you actually have those use cases.
#Which Tool Should You Pick?
The decision is rarely a tie. A few patterns hold up across most of the buying conversations we’ve watched.
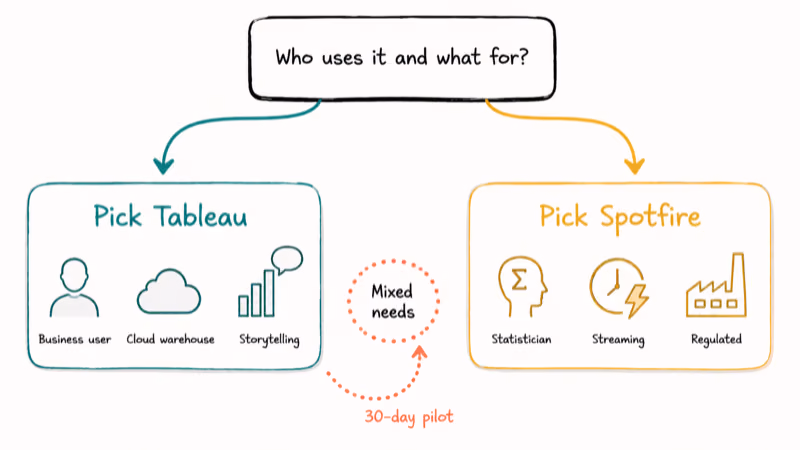
Pick Tableau if your buyers are business users, your analytics team is small, your data lives in standard cloud warehouses, and you care more about dashboard storytelling than statistical depth. The community and gallery alone shave weeks off ramp-up time.
Pick Spotfire if your team includes statisticians or domain scientists, you have real-time or streaming requirements, you operate in pharma, energy, or manufacturing, or you need in-database analytics on very large fact tables that can’t sensibly be extracted into memory. The price premium pays for itself when the alternative is gluing Tableau to several other tools to reach feature parity, especially once you account for the integration work and ongoing maintenance.
If neither feels right, our Tableau alternatives roundup walks through Power BI, Qlik, Looker, and others that can hit a different price-versus-power balance.
Buyers whose actual job is log analytics or observability rather than business intelligence should treat this comparison as the wrong shortlist entirely and instead start with our Splunk vs. ELK breakdown and our Splunk alternatives roundup, both of which compare ingest cost, query speed, and operational footprint on real machine data workloads.
#Bottom Line
For most buying scenarios in 2026, Tableau is the safer default. It wins on ease of use, connector breadth, community, and per-user price for analyst-heavy teams.
Spotfire stays the right call for a narrower but well-defined audience: regulated industries, operations groups with streaming needs, and teams that need embedded statistics or in-database analytics on very large datasets where pulling extracts isn’t an option.
If you’re a 30-person marketing analytics team in retail, buy Tableau.
If you’re a refinery operations team that needs real-time pipeline monitoring with statistical alerts and an audit trail, buy Spotfire bundled with TIBCO Streaming. The middle case (mid-sized companies with mixed needs) is where running a 30-day pilot on both with your real data is the only way to settle the question, because vendor demos always look great and the seams only show under your own load.
#Frequently Asked Questions
Can both Spotfire and Tableau connect to the same data sources?
Both connect to the major cloud warehouses, relational databases, file formats, and common SaaS sources. Tableau ships with the broader native connector library, while Spotfire fills gaps through ODBC, JDBC, and TIBCO Data Virtualization.
Which tool handles very large datasets better?
Spotfire generally has the edge for very large fact tables because of its in-database analytics path, which pushes computation to the warehouse instead of pulling everything into memory. Tableau handles large data well too, especially when paired with extracts or live connections to columnar warehouses, but its default workflow is extract-friendly.
Does Tableau or Spotfire have better statistics?
Spotfire. The TERR engine lets analysts embed R code directly into visualizations, and the platform ships with stronger built-in statistical objects. Tableau covers basics like trend lines, forecasts, and clustering, but heavier modelling usually means calling out to R, Python, or a warehouse function.
Is there a free version of either tool?
Tableau Public is free but publishes your workbooks to a public gallery, so it works for portfolio building, not internal data. Spotfire doesn’t have an equivalent free tier. TIBCO instead offers a 30-day trial of Spotfire Analyst that includes most authoring features and lets you work with private data, which is the better fit for evaluating it inside a real organization. Either path is enough to build a small proof of concept before committing to a paid seat.
Which tool has the bigger user community?
Tableau, by a wide margin. Spotfire skews enterprise.
Which is easier to deploy on-premises?
Both support on-premises deployment, but Spotfire historically has the deeper on-prem story given its roots in industries that often can’t use public cloud. Tableau Server is straightforward to install but most new deployments now use Tableau Cloud.
Which tool integrates better with Python and R?
Roughly a tie. Tableau calls out to TabPy and Rserve in a separate process, while Spotfire’s TERR runs R inline.
Will switching tools force us to rebuild every dashboard?
Yes. Workbooks don’t transfer between the two. The data sources, calculations, and visualizations all need to be rebuilt, although the conceptual work (which charts answer which question) carries over. Plan for a 30 to 60 day migration window for a mature dashboard portfolio.
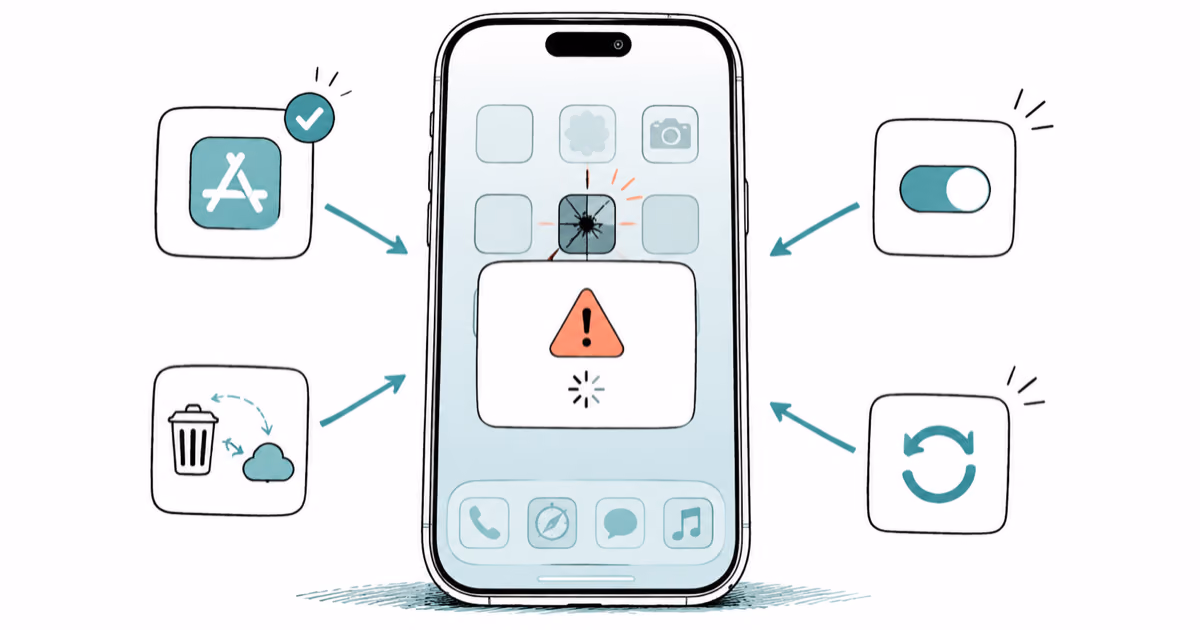
Apps Crashing After iOS 27 Update? Fix Order (2026)
Apps crashing after the iOS 27 update? Update the app in the App Store first, then offload and reinstall to clear stale cache, then restart. The fix order.

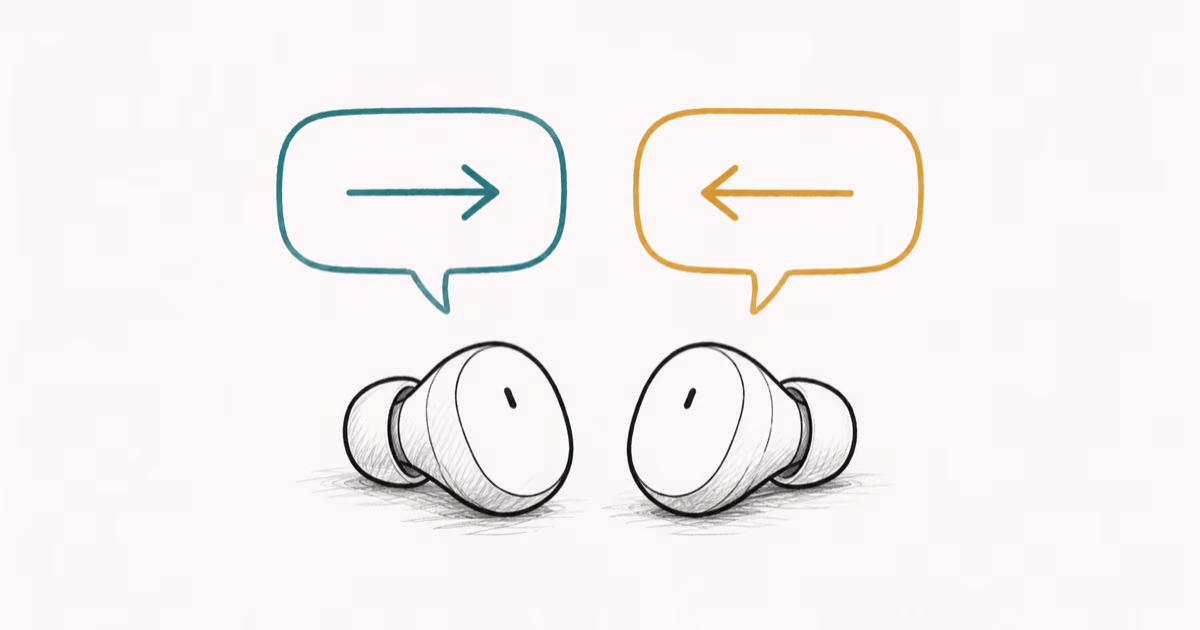
Do AI Translation Earbuds Work Offline? What to Know
Do AI translation earbuds work offline? A few do with downloaded language packs, but most need the cloud. Here's what works offline and what you give up.
How to Set Up Translation Earbuds (Pairing and Modes)
How to set up translation earbuds: charge, install the app, pair over Bluetooth, pick two languages, and choose a mode. A step-by-step first-use guide.

Translation Earbuds Not Translating? How to Fix Them
Translation earbuds not translating? Usually it's the app, the internet, or the language settings. Here's how to fix pairing, sound, and lag fast.