Tableau vs. Microstrategy: 2026 BI Tool Comparison
Tableau vs. Microstrategy in 2026: compare pricing, ease of use, dashboards, mobile BI, and the right pick for self-service or enterprise teams.
Quick AnswerTableau wins for self-service dashboards, ease of use, and Mac support. Microstrategy wins for enterprise governance, semantic-layer reuse with HyperIntelligence, and mobile BI. Tableau Creator starts at $75 per user per month, while Microstrategy enterprise tiers are quote-based.
Tableau vs. Microstrategy is the choice between a self-service visualization tool analysts learn in a week and an enterprise BI platform built around a governed semantic layer. Both tools build dashboards. They take different views on who builds those dashboards and how they get distributed across the organization.
The practical comparison is cost, learning curve, dashboard polish, and governance: Tableau optimizes for self-service analysis, while Microstrategy optimizes for governed enterprise BI.
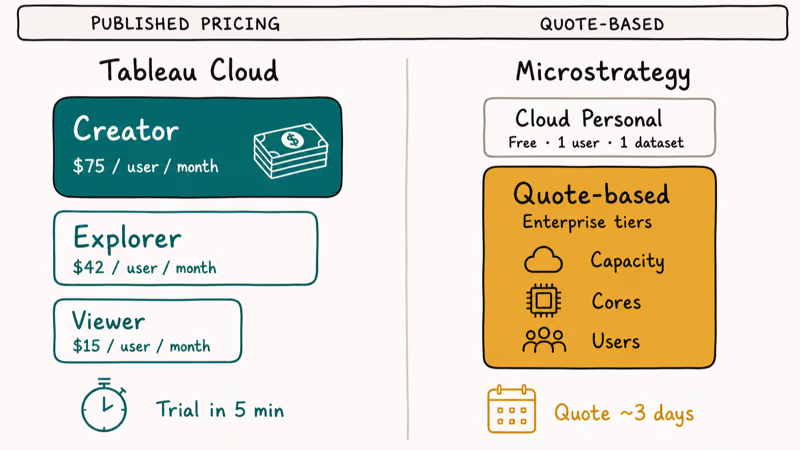
- Tableau Creator costs $75 per user per month, billed annually, on Tableau Cloud.
- Microstrategy uses quote-based pricing for enterprise deployments. The free Cloud Personal tier covers a single user and one connected dataset.
- Tableau leads on self-service dashboards and visual analysis depth; Microstrategy leads on governance, semantic-layer reuse, and mobile BI.
- Microstrategy’s HyperIntelligence injects semantic-layer cards directly into web pages and emails. Tableau has no equivalent feature.
- Tableau Desktop runs natively on macOS, but Microstrategy Developer is Windows-only and needs a VM or remote machine for Mac users.
#What’s the Difference Between Tableau and Microstrategy?
Tableau is a visual analytics platform built around the idea that an analyst should drag a field onto a canvas and see a chart in seconds. Its Wikipedia entry confirms that Salesforce acquired Tableau in 2019 for $15.7 billion, then the largest deal in Salesforce history. Microstrategy is an enterprise BI platform built around a metadata layer that defines metrics once and then reuses those definitions across every report, dashboard, and embedded card.
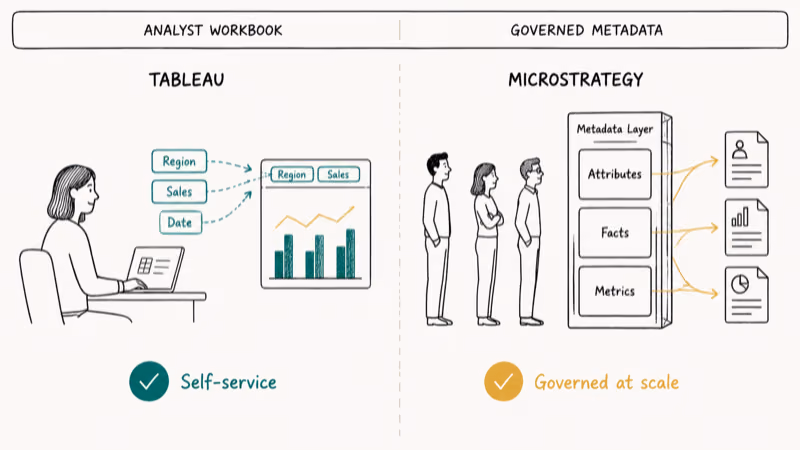
Different audience. Tableau is built for the analyst at a workbook. Microstrategy is built for the IT team governing metric definitions at scale.
According to Tableau’s pricing page, Creator licenses cost $75 per user per month, Explorer licenses cost $42, and Viewer licenses cost $15, all billed annually on Tableau Cloud. Microstrategy keeps a free Cloud Personal tier publicly listed but requires a sales conversation for everything above that.
Ownership matters too. Tableau is owned by Salesforce after the 2019 acquisition, so it gets pulled into the Salesforce ecosystem. Microstrategy has been independent since 1989, which keeps it vendor-neutral and willing to integrate with any data warehouse, CRM, or productivity suite.
#Tableau vs. Microstrategy: Pricing Compared
Tableau publishes prices. Microstrategy mostly does not. That gap explains a lot about which audiences each company targets.
| Tier | Tableau Cloud | Microstrategy |
|---|---|---|
| Free | Tableau Public (no private workbooks) | Cloud Personal (1 user, 1 dataset) |
| Entry analyst | Creator: $75 / user / month | Quote-based |
| Read-only consumer | Viewer: $15 / user / month | Quote-based |
| Enterprise | Server-based pricing | Quote-based, by capacity |
Tableau publishes Cloud pricing and supports a self-service trial. Microstrategy keeps enterprise pricing behind a sales conversation, so procurement usually starts with a quote request instead of a public checkout page.
For a 25-person Tableau Cloud team, Creator licenses at $900 per user per year would put the annual license line at $22,500 before any Viewer add-ons or enterprise terms. Microstrategy quotes for similar headcount usually land in a much wider range based on cloud capacity, on-prem servers, and intelligence-server cores you need.
If your CFO needs a price on a one-page slide, Tableau is the easier purchase.
#How Easy Is Each BI Tool to Learn?
Tableau has the gentler learning curve by a wide margin. Drag a date field to columns, drag a sales metric to rows, and you have a time-series chart. The “Show Me” picker recommends chart types from the fields you select, so a new user can ship a usable dashboard inside an afternoon.
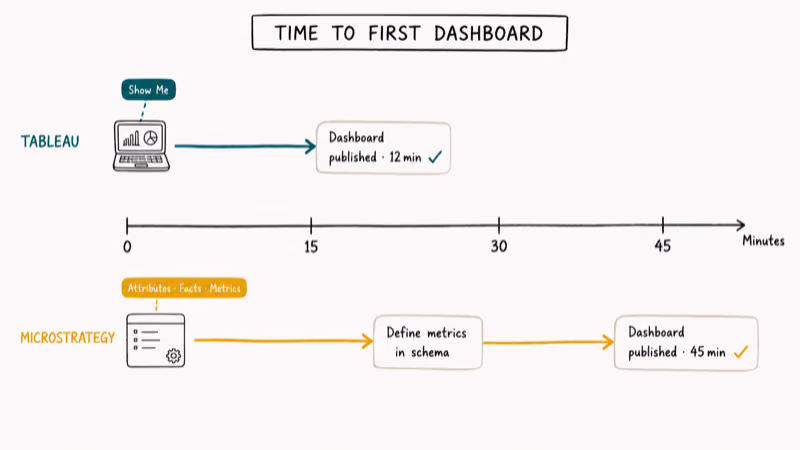
Microstrategy is structured. You build attributes, facts, and metrics in the metadata layer first, then assemble dashboards from those building blocks. That extra setup pays off when 50 analysts share the same definitions, but it’s rough on the analyst who just wants a quick chart.
G2’s user reviews of Tableau Desktop found that reviewers consistently rate Tableau higher on ease of setup and time-to-first-dashboard, while Microstrategy reviewers cite stronger governance and metadata management as the trade-off.
Tableau’s blank-workbook workflow is faster for a sales-trend dashboard because fields can be dragged straight onto the canvas. Microstrategy usually takes more setup because metrics and attributes are defined in the metadata layer before dashboard assembly.
For analyst speed, Tableau wins. For IT control over a single source of truth, Microstrategy’s structure is the feature, not the friction.
Coming from spreadsheets? Our Excel trend analysis guide is a fast warm-up before either BI tool.
#Visualization and Dashboards
Tableau is the standard for interactive visual analysis. Calculated fields, table calculations, and Level of Detail (LOD) expressions let analysts answer questions other tools push back to SQL. The dashboard layout engine is forgiving, and rendering is crisp on retina displays.
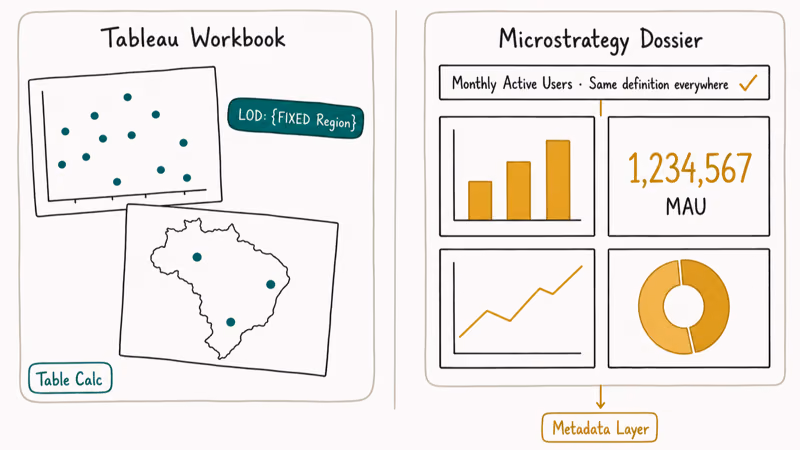
Microstrategy’s dossiers (its name for dashboards) look polished but feel less playful. The grid-based layout is more rigid. Chart customization needs more clicks. The trade-off: dossiers inherit metadata-layer definitions automatically, so a “monthly active users” filter behaves identically in every dashboard.
| Aspect | Tableau | Microstrategy |
|---|---|---|
| Built-in chart types | Wide library plus custom marks | Wide library, slightly fewer presets |
| Geospatial mapping | Native, with WMS server support | Native, with Mapbox integration |
| Custom JavaScript visuals | Tableau Extensions API | Custom Visualizations SDK |
| Mobile dashboard rendering | Decent, requires manual layout work | Strong, dossiers built mobile-first |
| Real-time data refresh | Minute-level on Cloud | Sub-minute on Server |
Both tools handle the basic chart types every analyst needs. Tableau pulls ahead on visual exploration depth. Microstrategy pulls ahead on dashboard distribution at scale.
#Enterprise Features: Mobile BI and Semantic Layer
This is where Microstrategy still beats Tableau, and it’s the reason large enterprises continue to renew Microstrategy contracts after evaluating cheaper options.
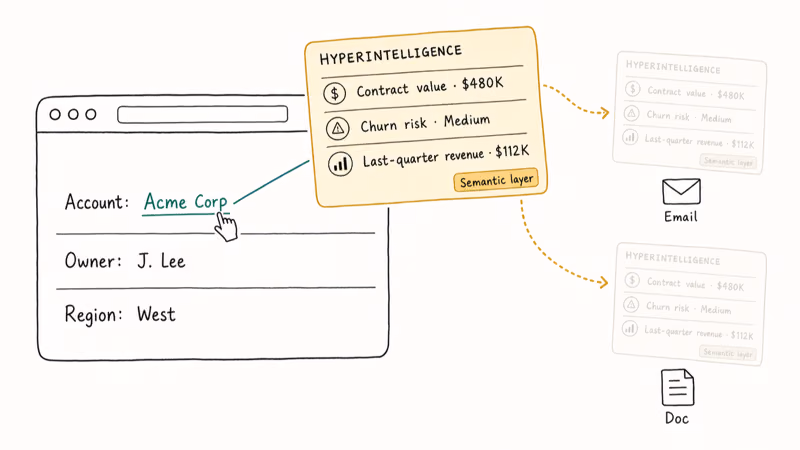
Microstrategy’s HyperIntelligence overlays semantic-layer cards on top of any web page, email, or Office document. A salesperson hovering over a customer name in Salesforce can see the customer’s contract value, churn risk, and last-quarter revenue without leaving the page. Tableau has no exact equivalent. Tableau Pulse, launched in 2024, surfaces metric summaries but does not inject contextual cards into other applications.
Microstrategy Mobile is purpose-built for offline-capable BI. Field reps can download a dossier, work without a connection, and resync changes later. Tableau Mobile works fine for online dashboard viewing but doesn’t match the offline depth.
According to Tableau’s official documentation, row-level security on Tableau Server uses user filters and database-level rules to restrict data per user or group. That works for most teams. Microstrategy’s object-level and metadata security model is more granular, which makes it easier to govern hundreds of dashboards where users in Region A can’t see Region B data.
Tableau closes the governance gap with the Catalog and Data Management add-ons. Both add lineage and quality monitoring on top of the base license. Tableau’s pricing page lists current rates for the Data Management add-on; expect another per-user fee on top of the Creator/Explorer/Viewer cost.
#Pick Tableau If, Pick Microstrategy If
Use Tableau when:
- Your analysts need to ship dashboards in days, not weeks.
- Most of your team works on macOS or wants a Cloud-first deployment.
- You want a published price tag without a sales call.
- You already use Salesforce and want native CRM integration.
Use Microstrategy when:
- IT must govern a single source of truth for metric definitions across hundreds of users.
- You need offline mobile BI for field operations.
- You want HyperIntelligence cards inside Outlook, Salesforce, or your own web apps.
- You have an enterprise procurement budget and prefer quote-based licensing.
Still on the fence? The 11 best Tableau alternatives roundup and Looker vs. Tableau head-to-head cover several other BI platforms worth evaluating before you sign a contract.
#Bottom Line
For a 25-person analytics team that wants dashboards in production by next month, Tableau Cloud at $75 per Creator is the right call. The published pricing saves a week of procurement back-and-forth, the trial is up in five minutes, and you can hand a Creator license to any analyst already comfortable with a spreadsheet.
For a 1,000-person enterprise that needs governed semantic-layer metrics, mobile BI for field reps, and HyperIntelligence cards inside other apps, Microstrategy still earns its quote-based price.
Already evaluated Spotfire and Tableau side-by-side or the Power BI, Tableau, and QlikView roundup? Tableau is the safer bet for the broadest analyst community and the most active learning resources.
#Frequently Asked Questions
Is Tableau better than Microstrategy?
Tableau is better for self-service analytics, ease of use, and quick dashboard delivery. Microstrategy is better for enterprise governance, mobile BI, and semantic-layer reuse. Which tool wins depends on whether you optimize for analyst speed or IT control.
How much does Tableau cost compared to Microstrategy?
Tableau publishes public per-user pricing across three Cloud tiers, with Creator licenses costing the most, Explorer in the middle, and Viewer the cheapest. Microstrategy doesn’t publish public prices for its enterprise tiers. Quotes typically scale with intelligence-server capacity and total user count, so two companies with the same headcount can land at very different yearly totals.
Can Tableau replace Microstrategy?
Tableau can replace Microstrategy for visual analysis, dashboarding, and self-service analytics. It can’t fully replace Microstrategy if your deployment leans on HyperIntelligence cards, deep offline mobile BI, or a multi-thousand-user semantic-layer governance program. Those features have no exact Tableau equivalent today.
Does Microstrategy work on Mac?
Microstrategy Workstation runs natively on macOS. Microstrategy Developer is Windows-only and needs a VM, Boot Camp, or remote Windows machine.
Which BI tool is easier to learn for beginners?
Tableau, by a clear margin. Most analysts can ship a usable dashboard in an afternoon using the drag-and-drop canvas and the Show Me chart picker. Microstrategy asks you to design the metadata schema first, which adds days or weeks of upfront learning before the first dashboard goes live.
Can Tableau and Microstrategy connect to the same data sources?
Yes. Both connect to Snowflake, BigQuery, Redshift, SQL Server, Oracle, PostgreSQL, MySQL, S3, Azure Blob, spreadsheets, and REST APIs. Tableau ships more native connectors out of the box, and Microstrategy makes up the gap with its connector framework.
Is Microstrategy still relevant in 2026?
Yes. Microstrategy continues to invest in HyperIntelligence and the embedded analytics SDK. The product still wins large enterprise renewals where governance and mobile BI matter more than analyst self-service.