Looker vs. Tableau: 2026 Comparison, Pricing, Verdict
Looker vs. Tableau in 2026: compare pricing, LookML modeling, deployment, connectors, and use cases. See which BI tool fits your team and budget.

Quick AnswerLooker is the better fit for governed, SQL-native analytics inside the Google Cloud stack. Tableau wins for self-service dashboards, Excel-style users, and offline or on-premise deployments.
Looker vs. Tableau really comes down to two questions: do you want governed analytics built around your data warehouse, or self-service dashboards anyone on the team can build? Both platforms compete for the same enterprise BI budget, but they solve different problems. The right choice depends less on a feature checklist and more on how your team works with data warehouses like Snowflake and BigQuery in 2026.
- Looker uses custom-quote pricing tied to platform licenses; Tableau publishes per-user subscription tiers and is cheaper for small teams to start.
- Looker’s LookML governance model centralizes metric definitions in version-controlled code; Tableau workbook calculations live per file with weaker reuse.
- Tableau ships three editions (Cloud, Server, Desktop) and supports offline authoring; Looker is browser-only and queries your warehouse live every time.
- Both connect to dozens of databases including BigQuery, Snowflake, Redshift, and Postgres; Tableau adds offline
.hyperextracts for cached dashboards. - Tableau is a Salesforce property since 2019; Looker is a Google Cloud property since 2020. Parent-cloud alignment matters more long term than any single feature.
#Looker vs. Tableau at a Glance
Here is how the two platforms line up on the dimensions that drive most buying decisions.
| Dimension | Looker | Tableau |
|---|---|---|
| Owner | Google Cloud (since 2020) | Salesforce (since 2019) |
| Pricing model | Custom quote | Per-user subscription |
| Hosting | Cloud-only | Cloud, Server, Desktop |
| Modeling layer | LookML (code) | Workbook (per file) |
| Live vs. extract | Live SQL only | Live or .hyper extract |
| Best for | Governed warehouse analytics | Self-service dashboards |
| Learning curve | Steeper, developer mindset | Gentler, drag-and-drop |
Looker is essentially a SQL generator with a strong governance layer on top. Every chart is a query against your warehouse. Tableau is closer to a visual-first canvas: drop a CSV in and you’ve got a dashboard in 10 minutes. You also pay for that flexibility in metric duplication later.
For a wider lens on how Tableau stacks up against other BI tools, see our Power BI vs. Tableau vs. QlikView breakdown.
#How Do Looker and Tableau Compare on Pricing?
Pricing is where the two diverge most. Tableau publishes its rates publicly. Looker does not.
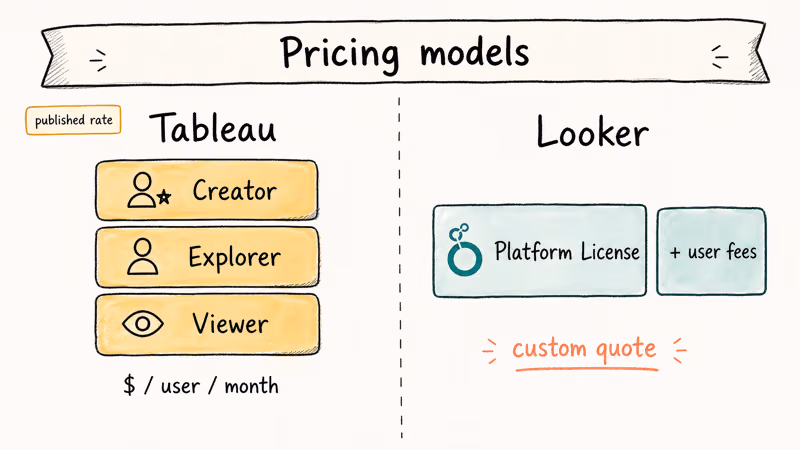
According to Tableau’s pricing page, Tableau Cloud is sold per user per month across three tiers: Creator (full authoring), Explorer (workbook editing), and Viewer (consumption only). Tableau Server, the self-hosted version, follows the same per-user model but is licensed annually. Tableau Desktop, the standalone authoring tool, is bundled into the Creator license.
Looker pricing is quote-based. Google sells Looker as a platform license plus per-user fees rather than a flat per-seat rate, which makes Looker harder to start small with. The trade-off: Looker’s pricing scales by platform capacity rather than seat count, so very wide read-only audiences become more affordable than the equivalent Tableau Viewer count.
Headcount drives everything here.
For teams under 20 users, Tableau is almost always cheaper to get into. For organizations rolling out dashboards to 500+ read-only users, Looker’s platform model can flip the math in its favor. If neither pricing structure fits, our Tableau alternatives roundup covers Power BI, Metabase, and Sigma at different price points.
#Data Modeling: LookML vs. Tableau Calculations
This is the biggest architectural difference between the two, and it shapes everything else.
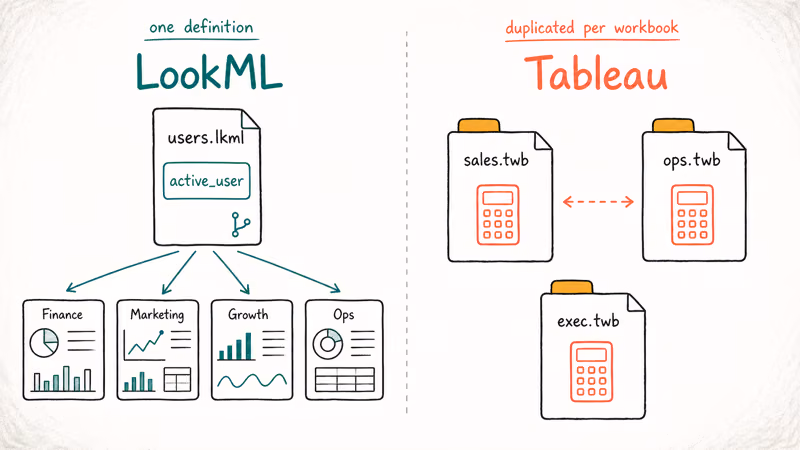
LookML is Looker’s modeling language. According to Google’s LookML documentation, it lets you define dimensions, measures, joins, and entire data models in version-controlled .lkml files. Every metric your business uses (“monthly active users,” “gross revenue,” “pipeline velocity”) gets defined once in LookML, reviewed in Git, and reused across every dashboard. If marketing and finance disagree on what an “active user” means, the disagreement happens once in code review, not 40 times across 40 workbooks.
Tableau’s modeling lives inside individual workbooks. Calculated fields, parameters, and table calculations are saved per .twb file. Tableau introduced Published Data Sources to let teams share definitions across workbooks, but adoption is uneven and the version-control story is weaker than LookML’s Git-native workflow.
The practical difference shows up when a team builds a shared metric like “weekly active users.” In Looker, LookML lets you define it once and reuse it across every dashboard immediately. In Tableau, the calculation gets copied into each workbook, which means future updates have to be edited file by file.
Pick based on your team, not on demos.
If your team has data engineers who write SQL daily and want strong governance, LookML is the better foundation. If your team is mostly business analysts who think in Excel pivots, Tableau’s per-workbook model feels more natural and ships faster.
#Which Tool Wins for Self-Service Analytics?
Self-service is Tableau’s home turf, and it shows.
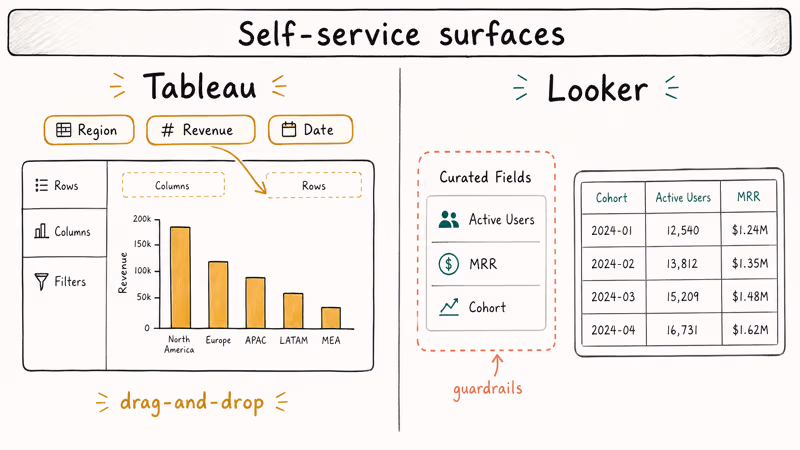
Tableau’s drag-and-drop interface lets a non-technical analyst build a dashboard in an afternoon. Drop a field on the rows shelf, drop another on columns, pick a chart type. The interface rewards visual exploration over upfront planning.
Looker’s self-service surface is the Explore interface. Users pick fields from a curated list (defined upstream in LookML) and build queries inside guardrails. The benefit is consistency: a Looker user literally can’t build a query that bypasses the governed metric.
The cost is friction. Explores feel constrained, and adding a new dimension requires editing LookML upstream rather than dragging a field on a canvas.
The trade-off is consistent: Tableau wins on time-to-first-dashboard while Looker wins on consistency across dashboards. The right answer depends on which problem hurts more for your team. For another take, see our Tableau vs. MicroStrategy comparison.
#Deployment, Hosting, and Offline Authoring
Tableau gives you three deployment paths:
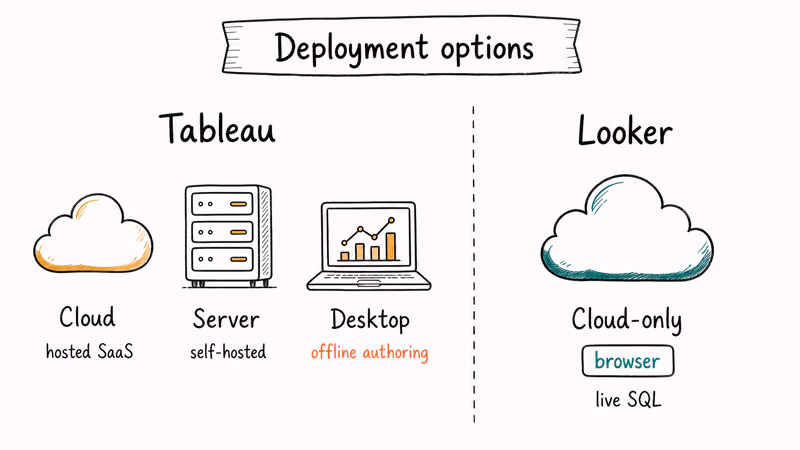
- Tableau Cloud is the fully hosted SaaS option. Setup takes minutes; Tableau handles patching and scaling.
- Tableau Server is the self-hosted enterprise option. You install it on Linux or Windows servers and manage everything yourself.
- Tableau Desktop runs locally on Mac or Windows. Authors can build dashboards offline against extracts, then publish to Cloud or Server when ready.
Looker is cloud-only. Customers can choose Google-hosted, AWS-hosted, or Azure-hosted Looker, but there is no Desktop equivalent and no air-gapped option. Every query goes to your warehouse over HTTPS in real time. For organizations with strict data-residency requirements that need a fully on-premise option, Tableau Server is the only choice between the two.
Salesforce announced the Tableau acquisition in June 2019, and the long-term roadmap leans toward Salesforce CRM integration. Google completed the Looker acquisition in 2020, and Looker has since been positioned as the analytics layer of the Google Cloud data stack alongside BigQuery and Dataform. If your organization already standardized on one of those clouds, parent alignment is a real factor in the decision.
#Connectors and Data Sources Compared
Both platforms cover the major warehouses and operational databases.
Looker’s documentation states that Looker supports more than 50 database dialects natively, including BigQuery, Snowflake, Redshift, Postgres, MySQL, SQL Server, Databricks, and Oracle. Looker queries every source live: there is no extract layer. That is a feature for warehouses with fast query engines (BigQuery, Snowflake) and a problem for slower databases.
Tableau supports a larger connector set and adds two performance modes that Looker does not have. Tableau’s extract documentation confirms that .hyper extracts use its in-memory data engine and let dashboards stay responsive even when the source database is slow. The trade-off: extracts can go stale if the refresh cadence does not match how often the underlying data changes, so they suit reporting workloads more than real-time operational dashboards. Tableau gives you the choice; Looker does not.
A dashboard backed by a Tableau extract renders from the in-memory engine rather than waiting on a live warehouse round-trip, so it tends to feel faster than the same query running against a live Snowflake table through Looker. For Snowflake-heavy shops, the live-query model is fine. For Postgres-heavy shops with reporting tables, Tableau’s extracts pay for themselves.
Cache where you can.
For analytics workloads that need both visualization and observability data, our Splunk vs. ELK comparison covers a different category of tooling that complements both Looker and Tableau.
#Real-World Workflows Compared
The clearest way to understand the difference is to follow a typical sales-pipeline dashboard from blank canvas to shipped report. Three things matter most to most teams: time-to-first-dashboard, second-dashboard time once a model already exists, and dashboard render latency when a viewer loads the page.
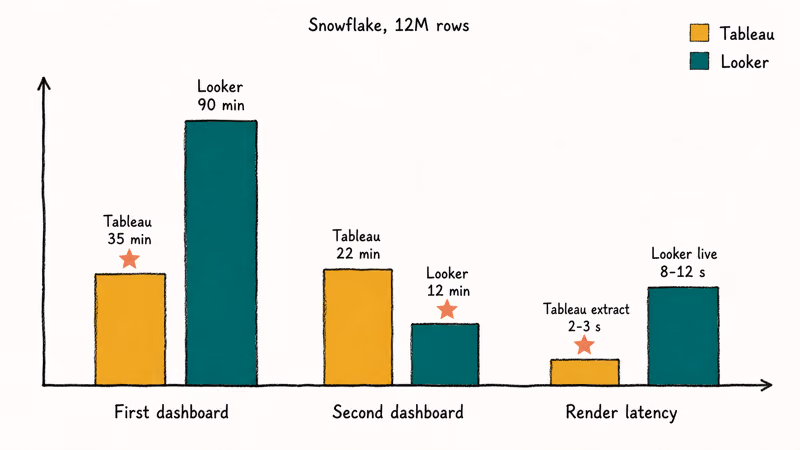
Tableau Desktop is fast to the first dashboard. A non-technical author can go from a blank canvas to a four-panel dashboard with filters and a date parameter in a single sitting, and most of that time is visual iteration rather than data preparation.
Looker is slower to that first dashboard because the upfront work goes into writing LookML. After that, each new dashboard is fast. Tableau rebuilds its calculations from scratch every time.
The pattern is well established across BI teams: Looker carries a higher upfront modeling cost and a lower marginal cost per dashboard, while Tableau is the opposite. Build one dashboard and Tableau wins on speed; build a library and Looker’s reuse pays off.
#Bottom Line
Pick Looker if your data lives in BigQuery or Snowflake, you want every team to use the same definition of “monthly active users,” and you have at least one engineer who can own LookML files in Git. Looker fits Google Cloud shops with strong data-engineering culture and centralized analytics teams. The upfront LookML investment pays back the moment you ship the third or fourth dashboard against the same model.
Pick Tableau if you need self-service speed, offline authoring, visual analysts, or Salesforce CRM integration. Tableau Cloud Creator goes from CSV to board-ready in a single afternoon.
For alternatives, see our Spotfire vs. Tableau breakdown.
#Frequently Asked Questions
Can Looker and Tableau be used together?
Yes, often. Looker handles governed KPI dashboards while Tableau covers ad-hoc analysis. Looker exposes a JDBC driver Tableau can query, keeping LookML authoritative.
Is Looker or Tableau better for large datasets?
Both handle billions of rows on a fast warehouse. Tableau wins on slow source databases through .hyper extracts; Looker wins on columnar warehouses like BigQuery, Snowflake, and Databricks where the warehouse itself does the heavy lifting.
Do Looker and Tableau both connect to cloud-based data sources?
Yes, both cover the full Big Three: AWS, Azure, and Google Cloud.
What are the main alternatives to Looker and Tableau?
The strongest alternatives are Microsoft Power BI (best for Microsoft 365 shops), Sigma Computing (spreadsheet-native and warehouse-live like Looker), Metabase (open-source, low cost), Apache Superset (open-source, code-first), and Domo (mid-market focused). Each one optimizes for a different combination of cost, governance, and ease of use.
Does Looker require LookML to use it?
Yes. Looker without LookML loses the governance layer that makes Looker valuable in the first place. A fresh Looker project starts with auto-generated LookML from your warehouse schema, but most teams refine those files significantly. If your team can’t maintain LookML, Looker is the wrong choice.
Can Tableau work without an internet connection?
Yes, fully offline through Tableau Desktop and .twbx packaged workbooks.
Is Tableau easier to learn than Looker?
For most non-technical users, yes. Tableau’s drag-and-drop interface produces a useful chart inside the first hour. Looker’s Explore interface is also point-and-click, but the underlying value of Looker only shows up after someone has invested in the LookML model. The first-week learning curve favors Tableau; the first-year sustainability curve favors Looker.
Which one has better support and community?
Tableau has the larger community given its longer history and the free Tableau Public tier. Looker’s community is smaller but more developer-leaning, with strong forums on the Looker Community site and Google Cloud’s official documentation. Both vendors offer paid support contracts through their parent companies.