Splunk vs. ELK Stack: 2026 Side-by-Side Comparison
Splunk vs. ELK Stack compared on cost, deployment, search, dashboards, and community. See which log management platform fits your team in 2026.

Quick AnswerSplunk wins on out-of-the-box dashboards, faster setup, and enterprise SIEM features, while the ELK Stack costs less, scales on open-source software, and gives engineers full control over the pipeline. Pick Splunk if you want polished tooling on day one, or ELK if you've got the staff to run it yourself.
Splunk vs. ELK Stack is the long-running argument inside almost every IT, DevOps, and security team that ships logs at scale.
Both platforms ingest machine data, index it, and turn the result into searches, alerts, and dashboards. The trade-off is rarely about features alone. It’s about how much time, money, and engineering attention you’ll spend before you get answers out of your logs, and how much of that work you want to own versus pay a vendor to handle for you.
This comparison covers pricing, deployment, query power, dashboards, ecosystem, and security. If your shortlist also touches BI tools, the Spotfire vs Tableau and Power BI vs Tableau vs QlikView breakdowns cover that side of the stack.
- Splunk indexes, searches, and visualizes machine data on a commercial license, with workload, ingest, or compute tiers that scale fast at hundreds of GB per day.
- ELK Stack bundles Elasticsearch for search, Logstash and Beats for ingest, and Kibana for dashboards, with the core software free under the Elastic License v2 or AGPL.
- Splunk Web ships finished out of the box, while Kibana needs index patterns, mappings, and dashboard work before non-engineers can self-serve.
- SPL is purpose-built for log analytics with chained piped commands, and Elasticsearch uses a JSON Query DSL plus Kibana Query Language and ES|QL for ad-hoc work.
- Total cost favors ELK at small to medium scale and shifts toward Splunk Cloud once you account for storage hardware, on-call hours, and SIEM expertise.
#What is Splunk and what does it do?
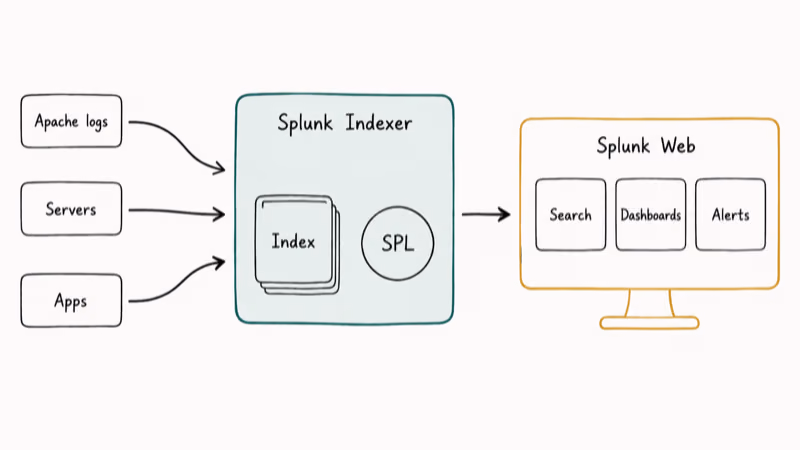
Splunk is a commercial log management and analytics platform built around a proprietary index, a web UI, and a query language called Search Processing Language. According to Splunk’s product overview, Splunk Enterprise ingests data from thousands of sources, indexes it for fast searches, and powers dashboards, alerts, and machine learning workloads from one tier.
The platform is sold under several SKUs: Splunk Enterprise on your own infrastructure, Splunk Cloud as SaaS, and Splunk Enterprise Security as the SIEM upsell. Splunkbase covers most enterprise sources.
Splunk’s documentation states that SPL has more than 140 commands across reporting, statistics, and correlation. According to the Splunk Search Tutorial, searches chain commands like search, stats, eval, and timechart with pipes, which makes log queries read more like Unix pipelines than database SQL. The syntax prefers composition over nesting, and SPL muscle memory carries over cleanly between Splunk Enterprise, Splunk Cloud, and the free dev tier.
For background and version history, the Splunk article on Wikipedia tracks the company timeline and the major Splunk Enterprise releases.
#Inside the ELK Stack
ELK is an open-source bundle named after its three original components: Elasticsearch, Logstash, and Kibana. Elastic now markets the bundle as the Elastic Stack and adds Beats, the lightweight shipper family that runs on every host you collect from. According to Elastic’s product page, the stack centers on Elasticsearch as a distributed search engine, with shards spread across nodes for scale. Most production clusters run on three or more nodes once you grow past a single-host install.
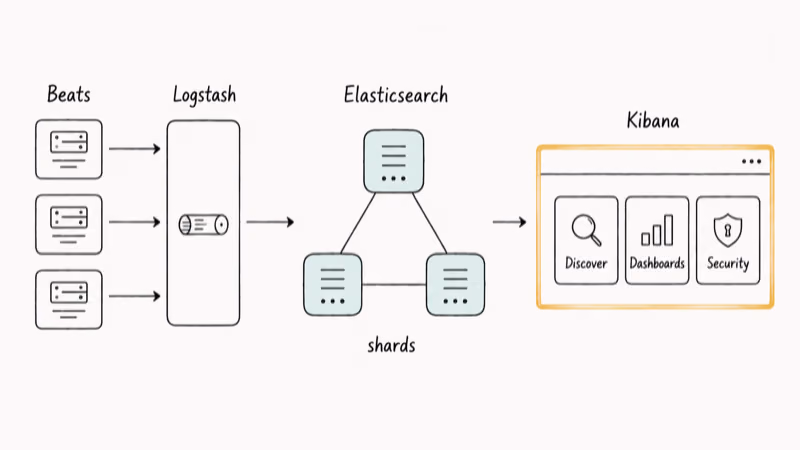
Each component has a clear job. Logstash and Beats collect logs, metrics, and traces. Logstash parses, filters, and enriches events before forwarding them to Elasticsearch. Kibana renders dashboards, runs queries, and hosts security and observability apps on top of the same indexes.
Licensing has shifted over the years. Today the core stack uses the Elastic License v2 or the AGPL, both of which are free for self-hosted use, with paid Elastic Cloud and commercial subscriptions covering features like alerting, machine learning, and the security app.
That mixed licensing model is one reason the ELK story is no longer “purely open source,” and you should read the license tiers before committing.
#Side-by-side feature comparison
Both platforms share the same broad shape. They both ingest data, index it, and serve searches, alerts, and dashboards. The differences show up once you pick a real workload and trace it from source to screen.
#Deployment and time to first dashboard
Splunk ships the entire experience in one installer. Splunk Web includes index management, search, alerting, and visualizations.
With a Splunk Cloud Free trial and a day’s worth of Apache access logs, the platform parses the data, suggests field extractions, and can produce a usable traffic dashboard the same afternoon. Setup from sign-up to first search is typically well under 30 minutes.
The ELK Stack is composed of services you wire together. On a self-hosted Elastic Stack cluster, the same workload can eat a full afternoon of Filebeat configuration, ingest pipelines, and index lifecycle policies before Kibana sees a single hit.
Elastic Cloud shortens that path by managing the cluster for you. Kibana dashboards still need index patterns and saved searches before non-engineers can self-serve.
#Search language and query power
SPL is opinionated and consistent. Once a team learns the pipe-and-command pattern, simple analytics like “top 10 user agents per hour” stay short, and complex pivots compose cleanly.
Elasticsearch has three query surfaces. The JSON Query DSL is precise and programmatic, Kibana Query Language is a friendlier filter syntax for dashboards, and ES|QL is Elastic’s newer piped query language that targets the same kind of ad-hoc analytics SPL is known for.
The flexibility is real. The learning curve is steeper because new analysts have to pick the right tool for the job rather than learning one query language.
#Dashboards and ecosystem
Splunk Web’s visualization library is mature and tightly coupled to SPL. Time charts, geographic maps, drilldowns, and pivot tables all render with a few clicks once a search returns results. Splunk also has long-standing apps for IT Service Intelligence and Enterprise Security that ship with curated dashboards for SREs and SOC analysts.
Kibana has caught up on visualization breadth and now ships dedicated apps for Observability, Security, and Search. The trade-off is that Kibana expects you to model your data through index patterns and runtime fields first, which punishes teams that skip the data modeling step before building dashboards.
Splunkbase lists thousands of apps, technical add-ons, and integrations covering most enterprise sources. The Elastic Stack relies on Beats and Elastic Agent for collection, plus integrations from the Elastic Integrations catalog.
The Elastic catalog is smaller than Splunkbase but growing fast, and the open-source community fills gaps with Logstash filters, Beats modules, and Helm charts.
#Pricing and total cost of ownership
Splunk pricing is the most common reason teams evaluate alternatives. Splunk historically priced Splunk Enterprise on daily ingest, then introduced workload pricing and Splunk Cloud workload pricing tiers based on Splunk Virtual Compute units. Whichever model you land on, expect a steep curve once daily ingest crosses a few hundred gigabytes.
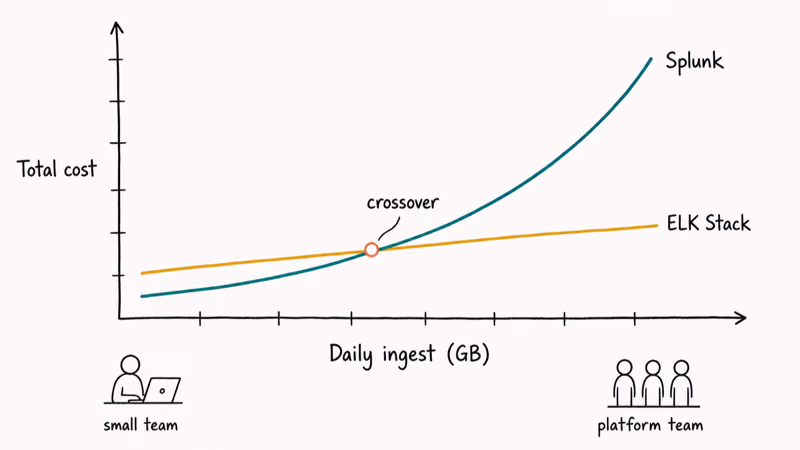
The ELK Stack is free to self-host. “Free” is misleading on its own.
You still pay for compute, storage, networking, and the engineers who run upgrades, hot-warm-cold tiers, snapshots, and security updates. Elastic Cloud removes most of the operations work for a per-hour bill that scales with cluster size and feature tier.
If you’re weighing log platforms against BI tools for cost, these analytics-space write-ups walk through similar pricing trade-offs:
- Looker vs Tableau: enterprise BI licensing models compared.
- Tableau vs MicroStrategy: seat-based versus capacity-based pricing.
- Tableau alternatives: cheaper BI options for tighter budgets.
#Security, alerting, and SIEM
Splunk Enterprise Security is a paid app that turns Splunk into a full SIEM with correlation searches, risk-based alerting, and a notable events workflow. Splunk Mission Control and Splunk SOAR extend that into automated playbooks. Teams running a 24x7 SOC often pick Splunk specifically for this stack.
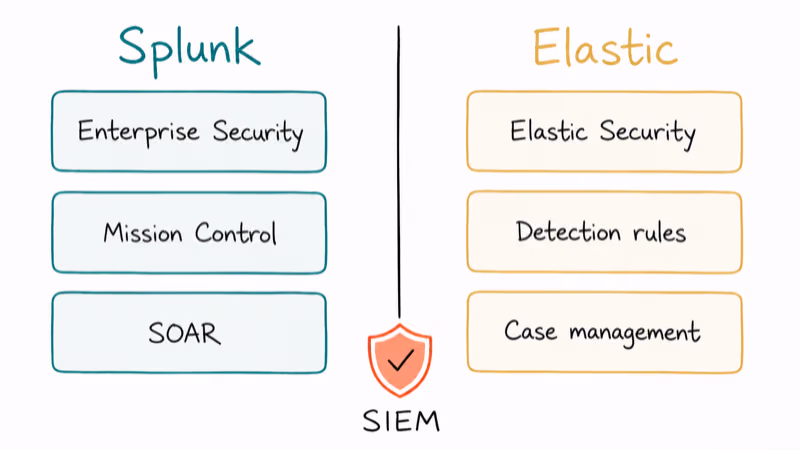
Elastic Security ships inside Kibana on the platinum and enterprise tiers and covers SIEM, endpoint, and threat hunting from one UI. The free basic tier still includes detection rules and case management.
Smaller security teams who want to consolidate logs and endpoint telemetry in one place often find Elastic’s bundle a better fit at a lower starting price.
#Which platform should your team pick?
There isn’t a single winner. Pick Splunk when fast time to value matters more than license cost: regulated industries with hard SIEM requirements, IT and security teams without the headcount to operate a distributed search cluster, and shops that want vendor support on a single throat to choke.
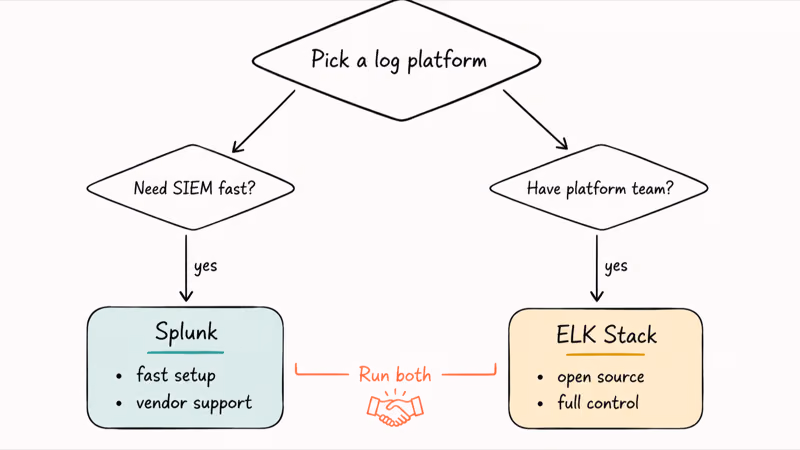
Pick the ELK Stack when you have engineers who can run distributed systems, when ingest volumes will grow past the point where Splunk pricing hurts, and when you want full control over schemas, retention, and dashboards.
Many teams end up running both. ELK absorbs high-volume application logs, and Splunk handles compliance-grade SIEM data. The split goes the other way at shops where Splunk arrived first.
If neither fits, our Splunk alternatives roundup compares Sumo Logic, Graylog, Datadog, and other contenders that sit between the two extremes.
#Bottom Line
Splunk is the right call when you need finished dashboards, polished SIEM workflows, and a vendor relationship more than you need a low license bill. That’s especially true if your team is small or your compliance scope is wide.
The ELK Stack is the right call when you have engineering depth and want full control over the pipeline. That fits best at hundreds of GB to TB per day.
If your daily ingest sits under 100 GB and your team is two engineers or fewer, start with Splunk Cloud Free or a small Splunk Cloud tier and revisit when ingest grows. If you already run Kubernetes or have a platform team, start with Elastic Cloud or self-hosted Elastic Stack 8 and budget for the operational hours up front.
#Frequently Asked Questions
Is Splunk better than the ELK Stack?
Neither is universally better. Splunk gives you a polished UI, mature SIEM tooling, and faster time to first dashboard. The ELK Stack gives you open-source licensing, deeper customization, and lower license cost at high ingest volumes. The right pick depends on team size, budget, and how much operational work you want to own.
Is the ELK Stack really free?
The core Elasticsearch, Kibana, Logstash, and Beats components are free to self-host. Paid Elastic features like alerting, machine learning, and Elastic Security live behind subscription tiers.
Can Splunk and ELK be used together?
Yes. Many enterprises ingest the same Beats or Universal Forwarder feeds into both platforms.
Which platform handles real-time log monitoring?
Both do, but with different ergonomics. Splunk indexes events as they arrive and supports real-time searches and alerts out of the box. The Elastic Stack streams data through Logstash or Beats into Elasticsearch with sub-second indexing on a tuned cluster, and Kibana alerts fire on rule schedules as short as one minute.
How does SPL compare with the Elasticsearch Query DSL?
SPL is a piped, command-oriented language built specifically for log analytics. The Elasticsearch Query DSL is a JSON-based search language designed for programmatic use across many data types, and Elastic’s newer ES|QL closes part of that gap with a piped syntax for ad-hoc queries.
Which platform is better for compliance and SIEM?
Splunk Enterprise Security has the longer track record in regulated environments, with mature correlation searches, risk-based alerting, and audit features. Elastic Security has narrowed the gap on the platinum and enterprise tiers and ships with built-in detection rules. For shops with strict audit needs and a dedicated SOC, Splunk is still the safer default. Smaller teams that already run Elastic for observability often consolidate security telemetry into Elastic Security to avoid running two platforms.
Do I need engineers to run the ELK Stack?
At small scale, no. At larger scale, self-hosting Elasticsearch requires people who understand distributed systems, JVM tuning, index lifecycle management, and snapshot strategy. Elastic Cloud removes most of that operational burden in exchange for a per-hour bill.

Best Apple Watch Band for Working Out: Proven Picks
The best Apple Watch band for working out handles sweat and stays put on your wrist. Compare silicone, nylon, and titanium picks for runs and lifts.

Best Apple Watch Bands: Proven Picks by Size and Style
The best Apple Watch bands depend on your case size group first, then your use. Compare silicone, nylon, stretchy, and steel picks for the right fit.
Best Charger for Google Pixel 10 Pro: PPS Picks 2026
The best charger for Google Pixel 10 Pro needs PPS. A 30W brick covers the 10 and 10 Pro; the Pro XL wants 45W. Four PPS picks compared here.

Best Charger for Samsung Galaxy S25 Ultra: 45W PPS Picks
The best charger for Samsung Galaxy S25 Ultra needs PPS to hit a full 45W. Compare four PPS picks and learn why most 45W chargers fall short here.