How to Fix JavaScript Errors in Your Browser (2026)
Browser JavaScript errors blocking a page? Read the console, clear faults, and restore Chrome, Edge, Firefox, or Safari with this 2026 guide.
Quick AnswerMost browser JavaScript errors clear after you disable extensions, clear site cache, and update the browser. For stubborn cases, use a fresh profile, reset site permissions, or open DevTools to capture the exact console message.
Browser JavaScript errors break pages in odd ways. A checkout button stops responding, a web app throws a red banner, or the screen freezes halfway through loading.
This guide applies only to a device or account you own.
Across Chrome, Edge, and Firefox on both Windows and Mac, the fix for these errors is almost always in your own browser rather than on the site. This guide walks through the exact checks in order, shows how to read the console, and gives you a decision tree so you stop guessing.
- Open DevTools with F12 or Option+Command+I on Mac and read the Console tab first
- Disable extensions one by one; ad blockers and script blockers cause the majority of these errors
- Clear site-specific data from the lock-icon menu, not the global cache, so other logins survive
- Update the browser when you’re three releases or more behind current stable
- If Incognito with all extensions off still shows the error, the bug is on the site’s end
#What Does a JavaScript Error Actually Mean?
A JavaScript error is a halt in the code that runs inside your browser tab. The engine starts executing scripts as soon as the HTML loads. When it hits a statement it can’t complete, it stops that script and logs a message.
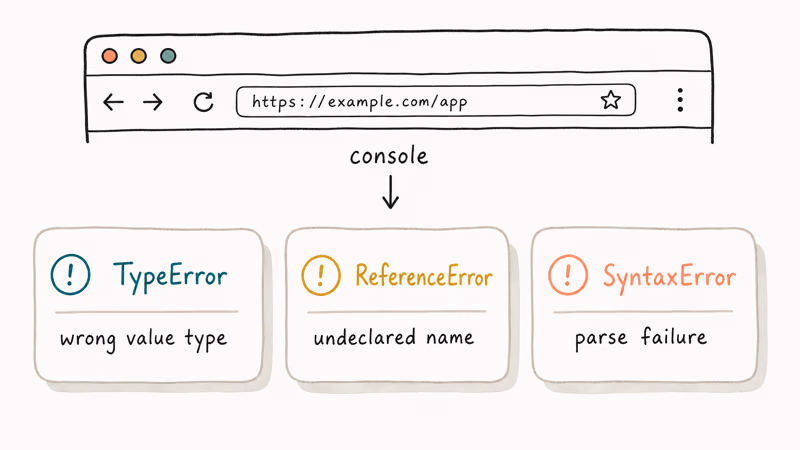
According to MDN Web Docs on Error types, the JavaScript engine recognizes 7 standard error types including TypeError, ReferenceError, and SyntaxError, each pointing at a different root cause.
A TypeError means the code called a method on the wrong kind of value. A ReferenceError means a variable name was never declared. A SyntaxError means the script file itself failed to parse, which almost always points to a corrupted or truncated download.
The important part: a JavaScript error in your browser is almost never your fault. The fix almost always lives on your side. You can open the Console, read the exact message, and match it to one of the categories below in under a minute.
#How Do I Open the Browser Console to See the Error?
Every major browser ships developer tools that expose the exact error. You don’t need to install anything.
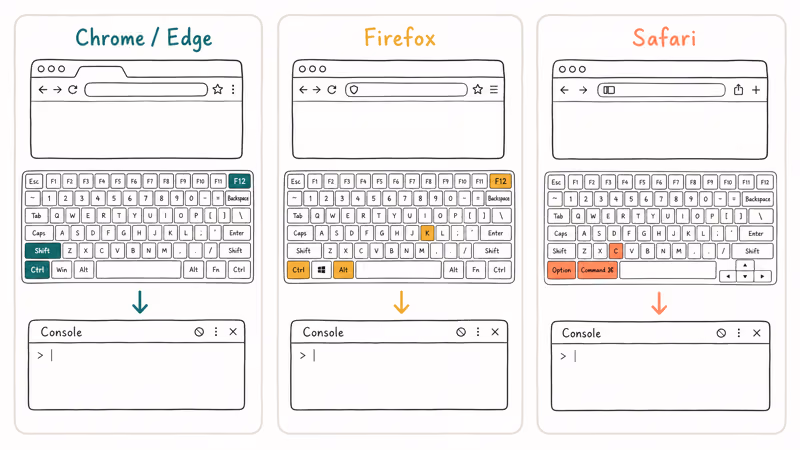
- Chrome, Edge, Brave, Opera: press F12 or Ctrl+Shift+J on Windows, Option+Command+J on Mac, then click the Console tab
- Firefox: press F12 or Ctrl+Shift+K on Windows, Option+Command+K on Mac
- Safari on Mac: first enable Develop in
Safari>Settings>Advanced> “Show features for web developers”, then press Option+Command+C
Reload with Ctrl+R or Command+R. Red lines are errors. Yellow are warnings you can ignore. Click any file name to jump to that line.
Google’s Chrome DevTools Console documentation confirms the Console panel is the primary entry point for JavaScript debugging. Turn on the Preserve log toggle before you reload. That keeps errors visible across page reloads, which matters most when a redirect clears the error a split-second after it fires, right before you can scroll up and read it.
A common example: a checkout page throws an “Uncaught TypeError” about a property it can’t read on an undefined object, and the console points straight at a third-party analytics script blocked by a privacy extension. Disabling that one extension usually fixes the checkout in seconds.
#Fix 1: Disable Browser Extensions
Extensions are the top cause of JavaScript errors on modern sites. They run scripts in the same context as the page and can remove or rewrite elements the site’s own code expects to find.
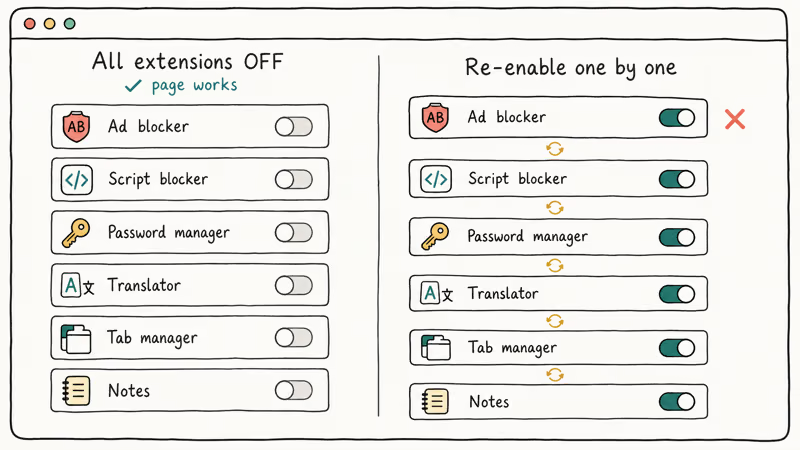
Open your browser’s extension page at chrome://extensions in Chrome, edge://extensions in Edge, or about:addons in Firefox, then toggle every extension off and reload the broken page. If it works now, flip extensions back on one at a time, reloading between each, until the error returns. That last extension is your culprit.
Ad blockers like uBlock Origin and AdBlock Plus, script blockers like NoScript, and older password managers are the usual offenders. Keep the extension and add the broken site to its allowlist instead of uninstalling.
Shortcut: open an Incognito or Private window. Extensions stay off there by default.
#Fix 2: Clear Cache and Site Data
A stale cached script is the second most common cause. The browser saves JavaScript files aggressively. When the site ships an update, the old cached script can conflict with the new HTML.
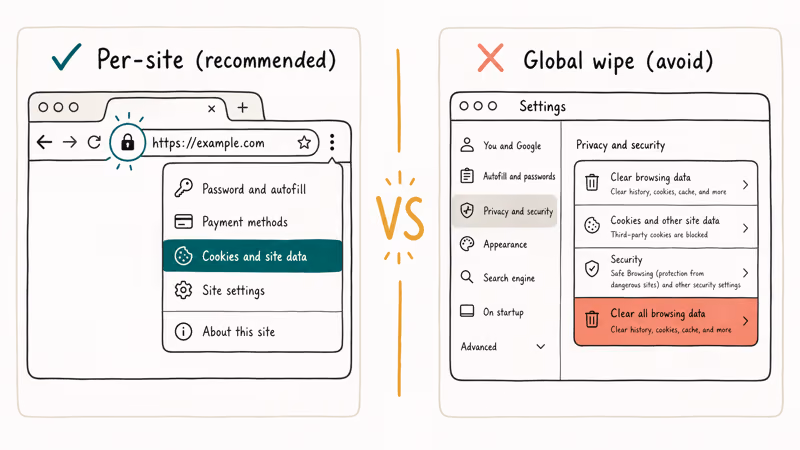
Mozilla’s support article on clearing the Firefox cache recommends the Clear Data option for the specific site instead of wiping everything, so you keep logins and preferences on other sites. The same approach works in Chrome and Edge.
Clear site data for just the broken site:
- Chrome or Edge: click the lock icon, then “Cookies and site data” > “Manage on-device site data” > trash icon
- Firefox: click the shield icon > “Clear cookies and site data” for this site
- Safari: go to
Settings>Privacy>Manage Website Data, search the site, and remove
After clearing, close the tab. Reopen the site. Hard-reload with Ctrl+Shift+R on Windows or Cmd+Shift+R on Mac to bypass any remaining cached copies sitting in memory. If the error came from a stuck service worker or corrupted IndexedDB store, this clears it without touching any other site, and the next reload installs fresh code from the server.
#Fix 3: Update Your Browser
Modern JavaScript relies on engine features. If your browser is on a version from two years ago, new syntax like optional chaining (?.) or the nullish coalescing operator (??) will throw SyntaxError on sites that use them.
Chrome’s release schedule shows the browser ships a new stable version roughly every 4 weeks per the Chromium Dash schedule. Edge follows the same cadence because it uses the same Chromium core. Firefox ships on a 4-week cycle as well.
Update steps:
- Chrome: three-dot menu >
Help>About Google Chrome - Edge: three-dot menu > Help and feedback > About Microsoft Edge
- Firefox: menu button >
Help>About Firefox - Safari: mac
OS System Settings>General>Software Update(Safari ships with the OS)
The browser checks and installs automatically. Relaunch when prompted.
If your browser refuses to update, the underlying cause is often a corporate policy, an outdated operating system, or a full disk. Check your free disk space first, then look for the error message during the update attempt. Our guide on Chrome being slow covers related system-level culprits like low RAM and background tab load.
#Fix 4: Try a Different Browser Profile
Browser profiles isolate cookies, extensions, and local storage. A corrupted profile can throw JavaScript errors on every site until you spin up a clean one.
In Chrome and Edge, click your profile avatar in the top right > “Add” or “Add profile”. In Firefox, type about:profiles in the address bar and click “Create a New Profile”. Load the broken site in the new profile with zero extensions installed.
If the site works in the fresh profile but fails in your main one, the main profile has a corrupted file.
You can either migrate bookmarks and passwords over, or reset the existing profile. In Chrome: Settings > Reset settings > “Restore settings to their original defaults”. That wipes extensions and site data but keeps bookmarks and passwords. On a heavy Chrome setup, our Chrome Task Manager walkthrough helps you spot which process is eating CPU during the reset.
#Fix 5: Check the Site in Another Browser
If every local fix fails, the error is on the site’s side. Load the same URL in a different browser engine.
Chrome, Edge, Brave, and Opera all use Chromium. Firefox uses Gecko. Safari uses WebKit. Testing across engines rules out a site-specific incompatibility with your main browser.
For example, a Discord web app might throw Uncaught (in promise) TypeError: Failed to fetch in Chrome while Firefox loads the same page cleanly on the same network. A common fix here is to disable hardware acceleration in Chrome Settings > System, which is a known workaround for GPU crashes on Apple Silicon Macs with some older Chromium builds.
If the site is broken in every browser, report the exact console error to the site’s support channel. Include the browser, version, operating system, and the line from DevTools. That’s the single most useful thing you can give a site operator.
For Chrome-specific connection errors that also break JavaScript loading, see our guides on ERR_CACHE_MISS in Chrome and ERR_CONNECTION_RESET in Chrome for the network-layer fixes that unblock scripts.
#The Discord or Skype JavaScript Error Is Different
The “A JavaScript error occurred in the main process” message that appears in desktop Discord, Skype, or other Electron apps is a different problem. Those apps ship a bundled Chromium runtime. The fix isn’t a browser setting but the installed app itself.
Quickest repair:
- Uninstall the desktop app
- Delete the leftover folder in
%AppData%\Roamingon Windows or~/Library/Application Supporton Mac - Reinstall the latest build from the vendor’s official site
Our Discord not opening guide covers the Discord-specific recovery steps in detail, and the javaw.exe missing error guide handles the related Windows runtime issue that sometimes shows up alongside Electron crashes.
If you still can’t open Discord after a clean reinstall, Microsoft’s support article on Microsoft Store app problems covers app repair and reset flows in Windows 11 at Settings > Apps > Installed apps, where you pick the app, click “Advanced options”, then “Repair” or “Reset”.
#Fix 6: Reset Site Permissions
Modern sites ask for camera, microphone, notification, and storage permissions. A conflicting permission state can trigger SecurityError or silent JavaScript halts that never render a user-facing message.
Open the site and click the lock or tune icon in the address bar. Click “Reset permissions” in Chrome and Edge, or “Clear permissions” in Firefox, then reload the page. The site will re-prompt for anything it actually needs.
This is the right fix when a video call site like Zoom web, Google Meet, or Microsoft Teams suddenly stops working after a browser update. According to Zoom’s web client troubleshooting article, clearing site data and permissions is the first recommended step for web-client failures that throw console errors, followed by checking third-party cookies.
#Fix 7: Disable Hardware Acceleration
Hardware acceleration pushes graphics and some script compilation to the GPU. On older GPUs or mismatched drivers, this can throw errors in pages that use WebGL, Canvas, or animation-heavy JavaScript.
- Chrome:
Settings>System> “Use hardware acceleration when available” — toggle off, then relaunch - Edge:
Settings>System andperformance > “Use hardware acceleration when available” - Firefox:
Settings>General>Performance> uncheck “Use recommended performance settings”, then uncheck “Use hardware acceleration when available”
After disabling, reload the broken page. If the error clears, your GPU driver is the root cause. Update the driver through Windows Update, NVIDIA’s official downloads, or Apple’s system update. Then re-enable hardware acceleration to get the speed back.
#Fix 8: Read the Exact Error and Check the Site’s Status Page
If all seven fixes above leave the error in place, the site itself is broken. Before you waste more time, copy the full error line from the Console and search it verbatim.
Popular services publish live status pages: Discord at discordstatus.com, Slack at status.slack.com, and Google Workspace at www.google.com/appsstatus. If a dependency like Cloudflare is down, you’ll see JavaScript errors on dozens of unrelated sites at once. The Cloudflare Status dashboard covers the infrastructure that fronts a large share of global web traffic, so one Cloudflare incident can break sites you’d never directly connect to them.
Search the error text on Stack Overflow too. If a site just shipped a broken release, other users will already be posting the same console line within minutes.
#Bottom Line: Which Fix to Try First
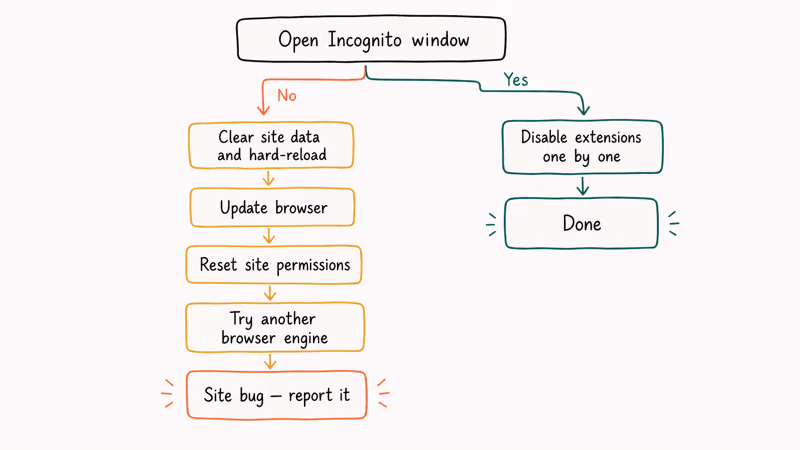
Open an Incognito window first. That single step isolates whether the problem is an extension or something else in under 15 seconds.
If Incognito clears the error, disable extensions one by one in your main window until the culprit reveals itself. If Incognito still fails, clear site data for that URL and hard-reload. Update the browser when you’re two or more releases behind current stable. Save hardware acceleration toggles and profile resets for last, since they touch global settings and affect every other site you use.
For the Electron app version of the error (Discord, Skype, VS Code throwing “JavaScript error occurred in the main process”), skip the browser fixes entirely. Uninstall the app, delete its AppData folder, and reinstall the latest build from the vendor’s site. It’s a different bug class that happens to share a name with the browser console error.
#Frequently Asked Questions
What does the “Uncaught TypeError: can’t read properties of undefined” error mean?
The script tried to read a property on an object that was never defined. It usually happens when a third-party script failed to load because of an ad blocker, CORS block, or network timeout. Scroll up in the Console for an earlier red line about a failed network request. That failed request is the real root cause.
Is it safe to disable JavaScript in my browser?
Yes. Nothing bad happens to your computer when you turn JavaScript off.
Why do I only get JavaScript errors on one website?
A single-site error points to a stale cache, a service worker stuck in a bad state, or an extension that conflicts with that one site. Clear site data through the lock-icon menu, hard-reload with Ctrl+Shift+R, then try Incognito if it persists. A specific extension is the likely culprit at that point.
Do JavaScript errors put my computer at risk?
No. A JavaScript error is a halt, not an exploit. The browser’s sandbox keeps the script inside the tab.
How do I stop seeing error pop-ups in Internet Explorer?
Internet Explorer 11 reached end of support on June 15, 2022 according to Microsoft’s IE 11 retirement notice. Modern sites no longer test against its JScript engine, which is why you see constant script errors. Switch to Microsoft Edge, which runs on Chromium and handles modern JavaScript the same way Chrome does.
Can a JavaScript error be fixed by restarting my computer?
Sometimes. A restart clears temporary memory and resets network state. It’s not a real fix for a recurring error though.
What is a service worker and how do I reset one?
A service worker is a background script the site installs to handle offline use and caching. A corrupted worker is a common source of persistent errors because it keeps serving the old broken code even after the site ships a fix. Open DevTools, go to the Application tab, click Service Workers, find the site in the list, and click Unregister. Reload the page and the site will install a clean worker from scratch on the next visit.
Why do JavaScript errors keep coming back after I clear cache?
If the error returns after a cache clear, the issue is a cached service worker that survives a normal wipe, an extension that’s still active, or a site-side bug the operator hasn’t fixed yet.
Bluetooth Not Working on Snapdragon X? Fixes for 2026
Bluetooth not working on your Snapdragon X Copilot+ PC? Generic audio, mice, and keyboards work, but vendor apps often lack an ARM build. Fixes inside.
Docker Desktop and WSL2 Not Working on Snapdragon X? Fix It
WSL2 runs fine on Snapdragon X, but Docker Desktop ARM is Early Access and throws WSL errors. Use WSL2 plus native ARM64 Ubuntu and Docker Engine.
Does iTunes Work on Snapdragon X? ARM Windows 11 Guide
Yes, iTunes runs on Snapdragon X laptops through Prism emulation, but the Apple Devices app is the smoother route. Here is what to install on ARM.
Does OBS Studio Work on Snapdragon X? ARM64 Build Guide
Yes, OBS Studio has an experimental ARM64 build since version 31.1, but x64 plugins won't load and hardware encoding is missing. Here is what works.