How to Use Google Chrome Task Manager to Fix Slow Tabs
Use Chrome Task Manager (Shift+Esc) to find memory hogs, kill frozen tabs, and spot rogue extensions. Every column explained with real RAM and CPU data.
Quick AnswerPress Shift+Esc in Chrome to open Task Manager. Select any tab or extension using too much memory or CPU, then click End Process to kill it. This is the fastest way to stop a single frozen tab without closing the entire browser.
Chrome’s built-in Task Manager lets you pinpoint which tab or extension is eating your RAM or CPU without guessing. It exposes live per-tab and per-extension resource use so you can identify the culprit without guessing.
- Press Shift+Esc on Windows (or
More Tools>Task Manageron Mac) to open Chrome Task Manager instantly - Each open tab, installed extension, and background process gets its own row with live CPU and memory figures
- Ending a tab’s process closes only that tab, not the entire browser
- Memory Footprint above 500,000 KB per process is worth investigating
- Stats refresh every 2 seconds, so wait a moment before reading CPU values
#How Do You Open Chrome Task Manager?
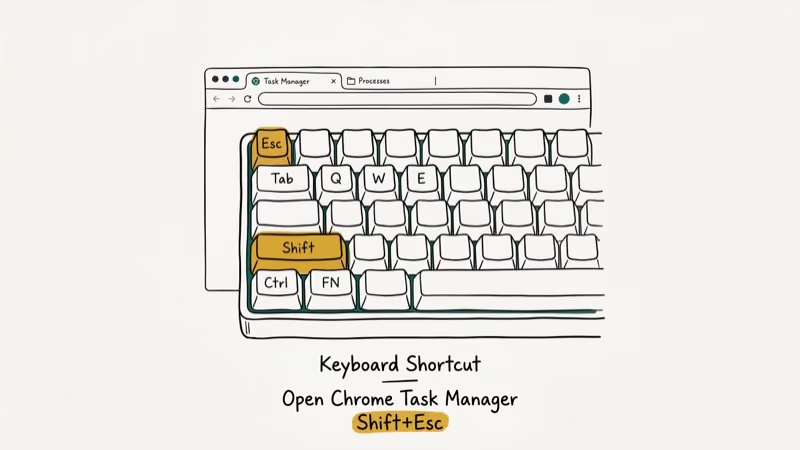
There are two ways to launch Chrome Task Manager. The fastest is the keyboard shortcut Shift+Esc on Windows and Linux. Press both keys simultaneously while Chrome is in focus and the window opens instantly.
On Mac, the keyboard shortcut doesn’t exist. Instead, click the three-dot menu in the top-right corner, hover over More Tools, and select Task Manager from the submenu.
The keyboard shortcut is the quickest route on Windows and Linux. The window opens as a separate floating panel, not a new tab. It doesn’t interfere with what you’re browsing.
If you’re troubleshooting Chrome running slowly overall, Chrome Task Manager helps you distinguish between browser-level issues and a single runaway tab. Once you know which process is the problem, you can kill it in seconds.
#Understanding Every Column in Chrome Task Manager
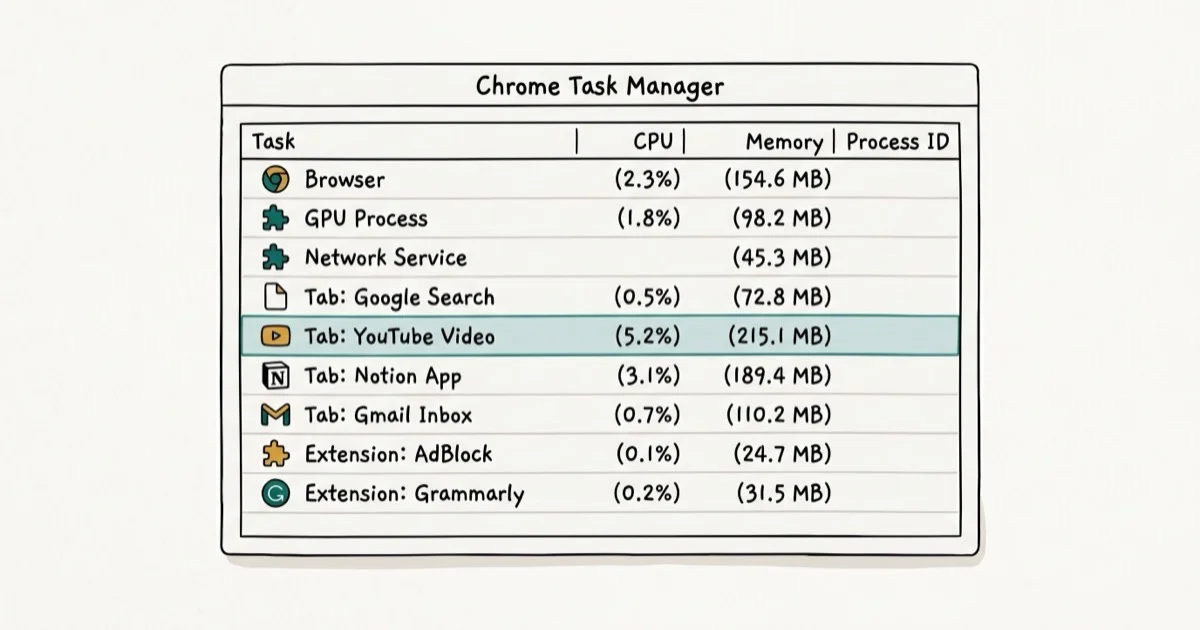
Chrome Task Manager shows more data than most users realize. Here’s what each column tells you:
Task lists the name of each process. Tab titles, extension names, GPU processes, and background workers all appear here. Double-clicking a row jumps you directly to that tab.
Memory Footprint shows how much RAM each process is using. According to Google’s Chrome DevTools documentation, each tab runs as a separate process, which is why Chrome can use several gigabytes of RAM with a dozen tabs open. Lightweight article tabs usually use less memory than video tabs like YouTube.
CPU shows the percentage of processor time each task is consuming in real-time. Background tabs usually show 0%, and an idle extension should also read 0%. A reading above 20% from a tab that’s not playing video usually signals a misbehaving script.
CPU Time tracks total processor time used since Chrome launched. A high CPU Time on an extension that’s been running for hours without doing any visible work signals a memory or processing leak. Check it after 4-6 hours of browsing to catch slow-burn problems the real-time CPU column misses.
Network shows real-time data transfer per process. Zero on a static page, high on video.
Process ID matches the Chrome process to what you’d see in Windows Task Manager or Activity Monitor on Mac. Right-clicking any column header lets you add extra columns including JavaScript memory, Cache storage, and CSS cache, which web developers find useful for diagnosing memory leaks.
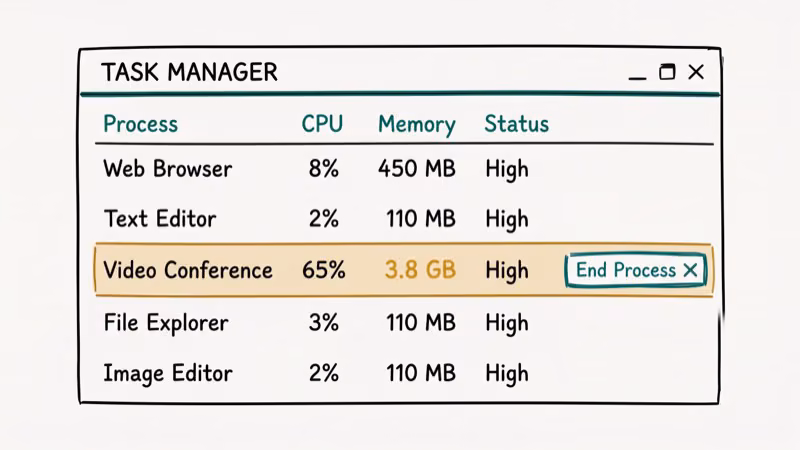
#Ending a Process in Chrome Task Manager
Select any row by clicking on it, then click the End Process button at the bottom-right of the window. Hold Ctrl (Windows) or Command (Mac) to select multiple rows at once.
Ending a tab’s process displays a “He’s Dead, Dave” error page. Click Reload to restart it. Ending an extension process stops it until Chrome restarts, which is handy when an extension freezes without needing to go to the extensions settings page.
You can’t end Chrome’s core browser process through this window. The Browser row at the top doesn’t respond to the End Process button. Chrome protects it intentionally.
Chromium’s process model documentation confirms that each tab runs in isolation so one crashed tab can’t bring down the whole browser. That isolation is exactly why ending a single process here is safe. According to Google’s Chromium design documentation, Chrome uses a multi-process architecture specifically to limit crash damage to a single tab or frame.
If you use a browser extension that’s causing issues, ending its process in Chrome Task Manager is faster than navigating to the extensions page.
#Why Does Chrome Use So Much Memory?
Chrome’s memory footprint can surprise users because a dozen-plus tabs can push total usage into the gigabytes. Chrome’s multi-process design is why each tab carries its own overhead.
The reason is Chrome’s process-per-tab architecture. Every tab, extension, and iframe runs in its own sandboxed process, which improves security and crash isolation but multiplies memory costs significantly with many tabs open.
Extensions add more overhead than most users expect. A few active extensions can add substantial combined memory overhead even on a blank or lightweight page.
Sort the Memory Footprint column by clicking its header to see your heaviest processes. Close tabs using over 600,000 KB that you rarely visit. Disable extensions consuming more than 200,000 KB.
Removing unused extensions is the single most effective way to reduce Chrome’s idle RAM.
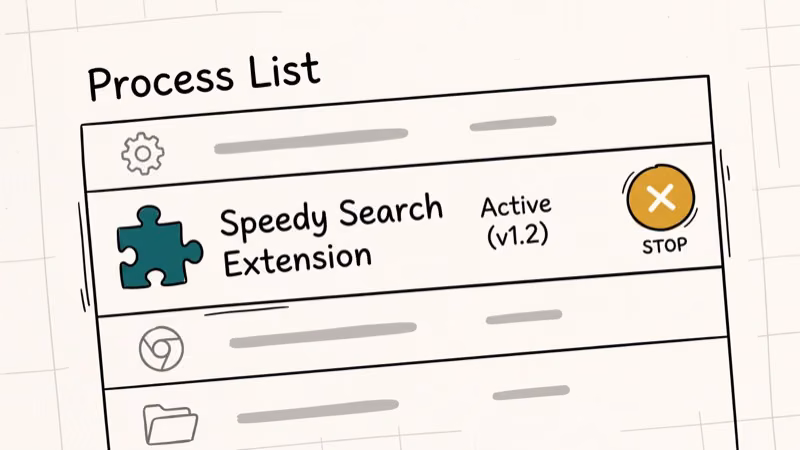
#Chrome Task Manager and Extensions
Every installed extension appears as its own row with its name clearly labeled. Extensions that inject scripts into every page (like ad blockers or password managers) show up under two rows: the extension itself and any page-specific scripts it’s running.
An extension that leaks memory grows its footprint slowly over hours. Checking Chrome Task Manager after a full day of browsing often reveals extensions that have grown far beyond their initial size. A leaking extension can balloon over a long browsing session without a restart.
If you see an extension consuming more than 300,000 KB of memory or more than 5% CPU consistently, try disabling it to see whether performance improves. Re-enable it from chrome://extensions if disabling has no effect.
#Chrome Task Manager vs. Windows Task Manager
Windows Task Manager treats Chrome as a single program with multiple processes. Chrome Task Manager gives you the same visibility but maps each process to its actual tab or extension name.
In Windows Task Manager, a frozen tab shows up as one of many chrome.exe processes. There’s no label to tell you which tab it’s representing. Chrome Task Manager shows the tab’s actual title, so you kill exactly the right process in one click.
How-To Geek’s browser process analysis confirms that Chrome spawns additional utility processes for audio handling, network service, and storage. These all appear in Chrome Task Manager but show up as unlabeled generic entries in Windows Task Manager, making it impossible to know what they’re doing without cross-referencing the Process ID column.
If you use both tools together, the Process ID column in Chrome Task Manager lets you match Chrome rows to Windows Task Manager rows for deeper CPU and disk I/O analysis. This is useful for tracking whether a tab is hammering your SSD even when CPU usage looks low. If Chrome throws ERR_CACHE_MISS errors, Chrome Task Manager can confirm whether a network process is stalling before you try other fixes.
#Bottom Line
Chrome Task Manager is the fastest tool for diagnosing high memory and CPU usage inside the browser. Open it with Shift+Esc, sort by Memory Footprint or CPU to find the culprit, and click End Process to stop it without closing Chrome.
If the same tab or extension causes problems repeatedly, close it permanently or uninstall the extension. For persistent browser sound issues or missing bookmarks, checking Chrome Task Manager rules out resource contention as a contributing factor.
#Frequently Asked Questions
Can I use Chrome Task Manager on Mac?
Yes, but the Shift+Esc shortcut doesn’t work on macOS. Go to the three-dot menu in the top-right corner, hover over More Tools, and select Task Manager. The window and all functionality are identical to the Windows version.
Is it safe to end processes in Chrome Task Manager?
Ending a tab process closes that tab and shows an error page. Ending an extension process stops the extension until Chrome restarts. You can’t damage your computer or Chrome installation by ending processes here. The worst that happens is losing unsaved data in a form you were filling out in the closed tab.
Why does Chrome Task Manager show multiple rows for the same page?
Pages with embedded frames (like ads, YouTube embeds, or third-party widgets) each run as separate subframe processes. A page with three embedded ads might show four rows: the main tab and one row per ad frame. This is intentional. Chrome isolates potentially untrustworthy third-party content from your page so a broken ad can’t crash your whole tab.
Does Chrome Task Manager work on Chromebook?
Yes. Chrome OS uses the same Chrome browser, and Shift+Esc opens Chrome Task Manager the same way. Chromebooks also have their own system-level task manager accessible via Search+Esc, which shows the full Chrome browser alongside other system processes.
How do I stop an extension from using too much memory?
Open Chrome Task Manager with Shift+Esc and sort by Memory Footprint. If the extension appears near the top, go to chrome://extensions and toggle it off.
Check memory usage again after a few minutes. If memory stays high with the extension disabled, the problem is likely a tab instead. If it drops significantly, the extension is the cause and you should find an alternative.
What does it mean when CPU shows a high value in a background tab?
A background tab with high CPU is usually running JavaScript. Common causes include crypto miners injected by malicious ads, auto-refreshing news tickers, or poorly coded web apps. End the process, then reload the page to confirm it spikes again. If it does, avoid the site or use an ad blocker to block the offending scripts.

Bluetooth Not Working on Snapdragon X? Fixes for 2026
Bluetooth not working on your Snapdragon X Copilot+ PC? Generic audio, mice, and keyboards work, but vendor apps often lack an ARM build. Fixes inside.

Docker Desktop and WSL2 Not Working on Snapdragon X? Fix It
WSL2 runs fine on Snapdragon X, but Docker Desktop ARM is Early Access and throws WSL errors. Use WSL2 plus native ARM64 Ubuntu and Docker Engine.

Does iTunes Work on Snapdragon X? ARM Windows 11 Guide
Yes, iTunes runs on Snapdragon X laptops through Prism emulation, but the Apple Devices app is the smoother route. Here is what to install on ARM.

Does OBS Studio Work on Snapdragon X? ARM64 Build Guide
Yes, OBS Studio has an experimental ARM64 build since version 31.1, but x64 plugins won't load and hardware encoding is missing. Here is what works.